はじめに
Jupyter Notebookはインタラクティブにスクリプトの開発ができる素晴らしい開発環境なのですが、iRubyとして動作させると少し機能に見劣りするところが無きにしも非ず。
とりわけ、グラフを描画する部分について、幾つかライブラリがあるもののエクスポートを行う場合には、受け取り側でも同じライブラリがないと閲覧することができないという状況で、少し不便。
[参考ライブラリ]
https://github.com/domitry/nyaplot
https://github.com/rdp/ruby_gnuplot
ということで、Pythonでmatplotlibを使った時のようにNotebookに保存できるグラフ環境が準備できないか調査してみましたので、その結果をまとめます。
ちなみに、昨日はchunky_png編を公開しています。
http://qiita.com/mix_dvd/items/2248798e914e997b650c
gnuplot
X11を使ったオープンソースソフトウェアにgnuplotがありますので、それを試してみます。
Macでgnuplotをインストールするには、XQuartzをインストールする必要がありますので、以下のURLからダウンロードします。
https://www.xquartz.org
次にgnuplotの公式サイトからダウンロードしてインストールします。
http://www.gnuplot.info
ちなみにMacであれば、XQuartzのインストール後に以下のコマンドを実行するとインストールできる...はずです。
$ cd Downloads
$ curl -OL https://downloads.sourceforge.net/project/gnuplot/gnuplot/5.0.5/gnuplot-5.0.5.tar.gz
$ tar xzf gnuplot-5.0.5.tar.gz
$ cd gnuplot-5.0.5
$ ./configure
$ make
$ sudo make install
サンプル表示
以下のコードを実行してみます。
require 'gnuplot'

Gnuplot.open do |gp|
  Gnuplot::Plot.new(gp) do |plot|

    plot.xlabel   "x"
    plot.ylabel   "y=x^3-2x+2"
    plot.grid

    x = (-20..20).collect { |v| v.to_f / 10.0 }
    y = x.collect { |v| v ** 3 - 2 * v + 2}

    plot.data << Gnuplot::DataSet.new([x, y]) do |ds|
      ds.with      = "linespoints"
      ds.linewidth = 2
      ds.linecolor = 3
      ds.notitle
    end

  end
end
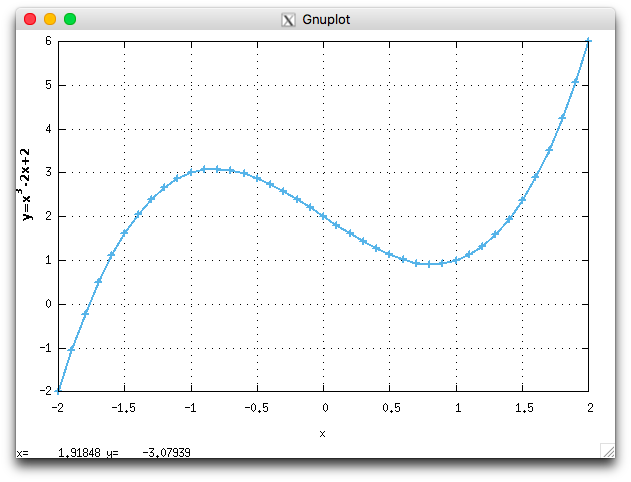
別ウィンドウが表示されてグラフが描画されました。
...インラインじゃない(-_-;)
インラインで表示してみる
前述のコードを変更して、SVGファイルを出力するよう設定してみます。
require 'gnuplot'
Gnuplot.open do |gp|
Gnuplot::Plot.new(gp) do |plot|
plot.terminal "svg"
plot.output "gnuplot.svg"
plot.title "作成例"
plot.xlabel "x"
plot.ylabel "y=x^3-2x+2"
plot.grid
x = (-20..20).collect { |v| v.to_f / 10.0 }
y = x.collect { |v| v ** 3 - 2 * v + 2}
plot.data << Gnuplot::DataSet.new([x, y]) do |ds|
ds.with = "linespoints"
ds.linewidth = 2
ds.linecolor = 3
ds.notitle
end
end
end
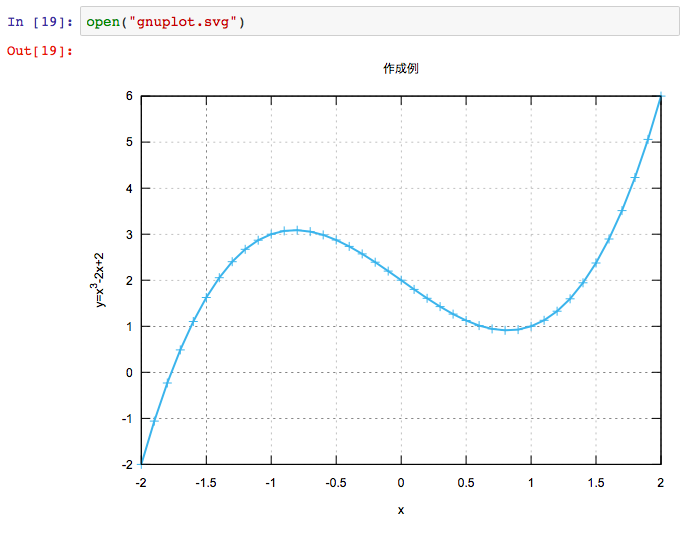
open("gnuplot.svg")
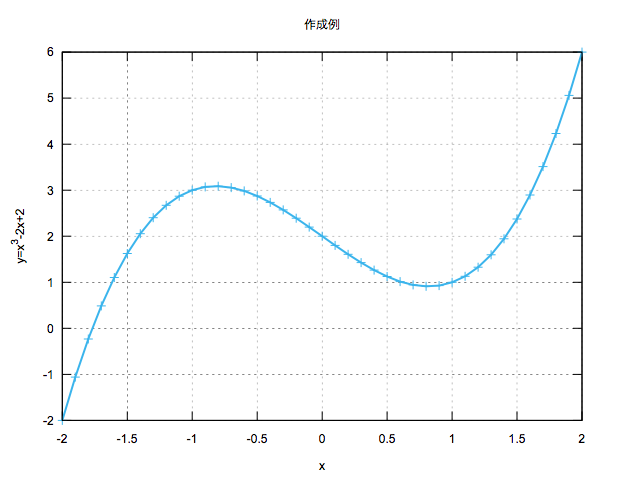
来たっ!
Notebookをエクスポートして確認してみる
「File」メニューから「Download as」でHTML形式をダウンロードします。
そして、そのファイルをブラウザで表示してみると...
来たっ!
しかも日本語も正しく表示されてる!!
これでiRubyを使ってグラフ作成して、自由にインラインで表示することができそうです。
よし、次は何しよう(^_^;)
フォントの指定
plot.terminal "svg"
の部分を
plot.set 'terminal svg font "ヒラギノ丸ゴ ProN W4, 12'
と変更したら、フォントの指定もできるようになりました(^-^)/