はじめに
mrknさんが開発されているPyCallが日々更新されているので、TensorFlowがRubyから使えないかと思い試してみたものです。
インストール
PythonやTensorFlowのインストール手順はQiitaにあふれているので、ここでは割愛します。
PyCallのインストールは以下のコマンドで
$ gem install --pre pycall
簡単なサンプルも含めて別の記事にまとめてあるので、それも参照してみて下さい。
PyCallでRubyからPythonのライブラリを使ってみた
ついでに、iRubyでグラフを描画するためのライブラリも入れておくと便利かもしれません。
インストールは以下のコマンドで
$ gem install --pre matplotlib
TensorFlow
何か簡単で良いテーマがないかと探したところ、以下のURLにて紹介されている最急降下法のサンプルがいいなと思ったので、これをPyCallを使って試してみます。
TensorFlowで始める深層学習 (2)サンプルコードから読み解くデータフロー・グラフ/Pythonエコシステム
内容を簡単に説明すると、
y = w \times x + b
という計算式を例に、ランダムに発生させたxの値とそこから計算されたyの値を使って、wとbを発見するというもののようです。
では、ソースコードを書き換えると以下のとおり。
tf.rb
require 'pycall/import'
include PyCall::Import

pyimport 'numpy', as: 'np'
pyimport 'tensorflow', as: 'tf'

# Create 100 phony x, y data points in NumPy, y = x * 0.1 + 0.3
x_data = np.random.rand.(100).astype.(np.float32)
y_data = x_data * 0.1 + 0.3

# Try to find values for W and b that compute y_data = W * x_data + b
# (We know that W should be 0.1 and b 0.3, but Tensorflow will
# figure that out for us.)
w = tf.Variable.(tf.random_uniform.([1], -1.0, 1.0))
b = tf.Variable.(tf.zeros.([1]))
y = w * x_data + b

# Minimize the mean squared errors.
loss = tf.reduce_mean.(tf.square.(y - y_data))
optimizer = tf.train.GradientDescentOptimizer.(0.5)
train = optimizer.minimize.(loss)

# Before starting, initialize the variables. We will 'run' this first.
init = tf.initialize_all_variables.()

# Launch the graph.
sess = tf.Session.()
sess.run.(init)

# Fit the line.
(0..200).each do |step|
  sess.run.(train)
  if step % 20 == 0 then
    puts "#{step}\t#{sess.run.(w)[0]}\t#{sess.run.(b)[0]}"
  end
end
# Learns best fit is W: [0.1], b: [0.3]
実行してみます。
$ ruby tf.rb
0	-0.075883001	0.61687899
20	0.031335868	0.34092095
40	0.082482144	0.31043994
60	0.095530763	0.30266351
80	0.098859809	0.30067953
100	0.099709123	0.30017337
120	0.099925794	0.30004424
140	0.099981084	0.30001128
160	0.099995196	0.30000287
180	0.099998787	0.30000073
200	0.099999689	0.30000019
できたっぽい!
iRuby上で実行
上記のソースコードを以下のように修正してiRuby Notebook上で実行。
# 略

# Fit the line.
w_log = []
b_log = []

(0..200).each do |step|
  sess.run.(train)
  #if step % 20 == 0 then
  #  puts "#{step}\t#{sess.run.(w)[0]}\t#{sess.run.(b)[0]}"
  #end
  w_log << sess.run.(w)[0]
  b_log << sess.run.(b)[0]
end
# Learns best fit is W: [0.1], b: [0.3]

pyimport 'matplotlib.pyplot', as: 'plt'
require 'matplotlib/iruby'
Matplotlib::IRuby.activate

plt.plot.(w_log)
plt.plot.(b_log)
plt.show.()
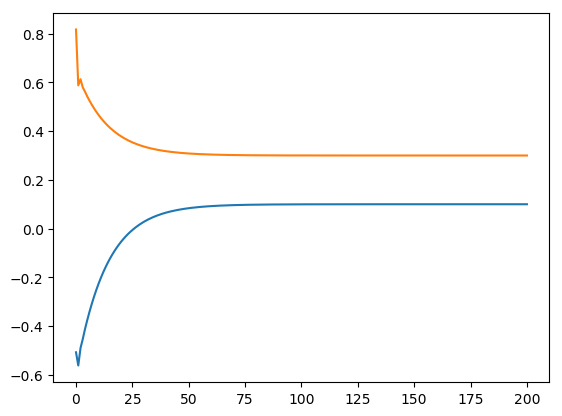
グラフが描画されました(^-^)