Bradley-Terry's Model
これは、「強さ」を図るモデルです。
簡単にいうと、試合の結果から各々の「強さ」を数値化できるよっていう概念です。
以下の論文が参考になりましたので、詳しくはこちらをご覧ください。
「強さ」に対する定量的評価法とその応用
n個の要素 (チームや個人) があり、何らかの対戦を行うものとする。
対戦は 1要素 対 1要素 のマッチで行われ、その結果は片方の要素の対して勝利、または敗北しか生じないとする。
何回か対戦した結果から各要素の「強さ」をはかるとする。
ここで要素 i が要素 j に勝利する確率を Pij としたとき、すべての組み合わせに対して、
Pij = πi / πi + πj (1)
となるπi を導入する。
式 (1) の関係式を Bradley-Terry(BT)モデルという。
BT モデルにおいて πi は,要素 i の強さを表すと考えることができる。
参考にしたもの
先日参加した、統計処理及び機械学習に基づくデータマイニング勉強会 #03での講義内容を参考にしています。
ここでBradley-Terry's ModelをPythonで実装したものが紹介されています。
(wsに代入されている数字は、交流戦の成績を除いた2014年度のセ・リーグ6球団の総勝数のリストです。便宜上、引き分けを0.5でカウントしています。)
ここで得られたthetaが各チームの「強さ」の数値です。
import numpy as np
theta = np.ones(6)/6.0 # \theta 初期値
t = np.zeros(6)
r = 24.0 # 対戦数
ws = np.array([66.5, 66.5, 66, 56.5, 55, 50.5])  # 総勝数
for iloop in range(0, 100):
    for i in range(0,6):
        acc = 0 # 総和用のアキュムレータ
        for j in range(0,6):
            if (j == i):
                pass
            else:
                acc += r / (theta[i]+theta[j])
        t[i] = ws[i]/acc
    s = sum(t)
    for i in range(0, 6):
        theta[i] = t[i] / s
過去5年間の戦力値遷移
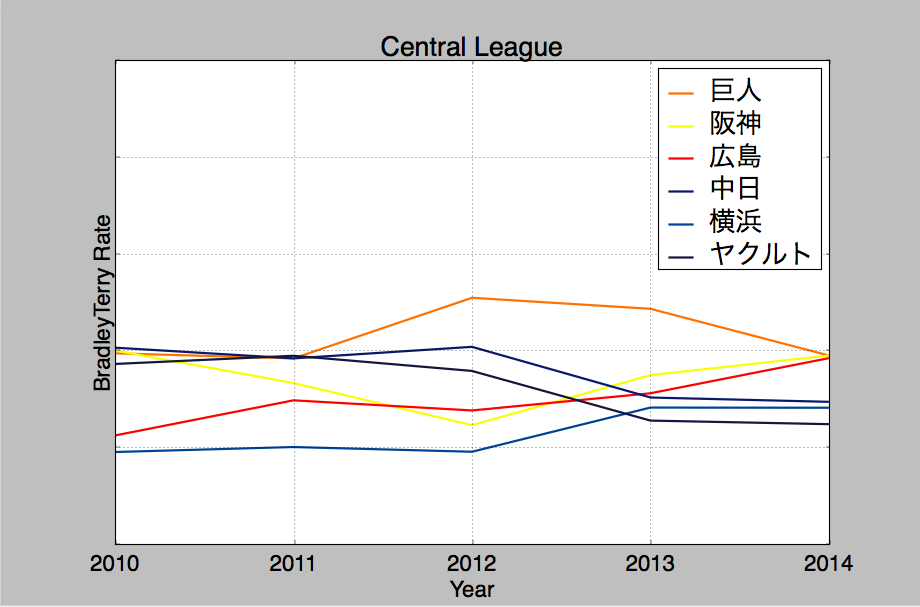
上記のBradley-Terry's Modelを参考に、セ・リーグの5年間の移り変わりをmatplotlibでグラフ化してみました。
#!/usr/bin/env python
# -*- coding: utf-8 -*-

import numpy as np
import matplotlib.pyplot as plt
import os

theta = np.ones(6) / 6.0
t = np.zeros(6)
r = 24.0

teams = [u"巨人", u"阪神", u"広島", u"中日", u"横浜", u"ヤクルト"]
colors = ["#f27b00", "#ffff00", "#ff0000", "#002468", "#044a90", "#111c3c"]
scores = [[67.5, 68, 48, 68.5, 42.5, 65.5], [66, 61, 57, 66, 43.5, 66.5], [76.5, 51.5, 55.5, 69, 43, 64.5], [74, 62.5, 58.5, 57.5, 55, 51.5], [66.5, 66.5, 66, 56.5, 55, 50.5]]
years = ["2010", "2011", "2012", "2013", "2014"]
points = [[], [], [], [], [], []]


def reset():
    global theta
    theta = np.ones(6) / 6.0

def bradley_terry(ws):
    for iloop in range(0, 100):
        for i in range(0, 6):
            acc = 0
            for j in range(0, 6):
                if i == j:
                    pass
                else:
                    acc += r / (theta[i] + theta[j])
            t[i] = ws[i] / acc
        s = sum(t)
        for i in range(0, 6):
            theta[i] = t[i] / s

if __name__ == '__main__':
    for score in scores:
        reset()
        bradley_terry(score)
        for i in range(0, 6):
            points[i].append(theta[i])

    for i in range(0, 6):
        data = np.loadtxt(points[i])
        plt.plot(
            data,
            linestyle="-",
            color=colors[i],
            label=teams[i],
            linewidth=2
        )

    plt.ylim(0, 0.5)
    X = np.arange(len(years))
    plt.xticks(X, years)
    plt.tick_params(labelleft="off")
    plt.xlabel("Year")
    plt.ylabel("BradleyTerry Rate")
    plt.title("Central League")
    plt.grid(True)
    plt.legend(loc="best")
    plt.rcParams.update({"font.size": 20})
    os.chdir("graph/")
    plt.savefig("central.eps")

    plt.show()
こんな感じになりました。
・巨人の安定的な強さ
・中日、ヤクルトの右肩下がり
・広島、横浜の右肩上がり
などが読み取れるのではないでしょうか…
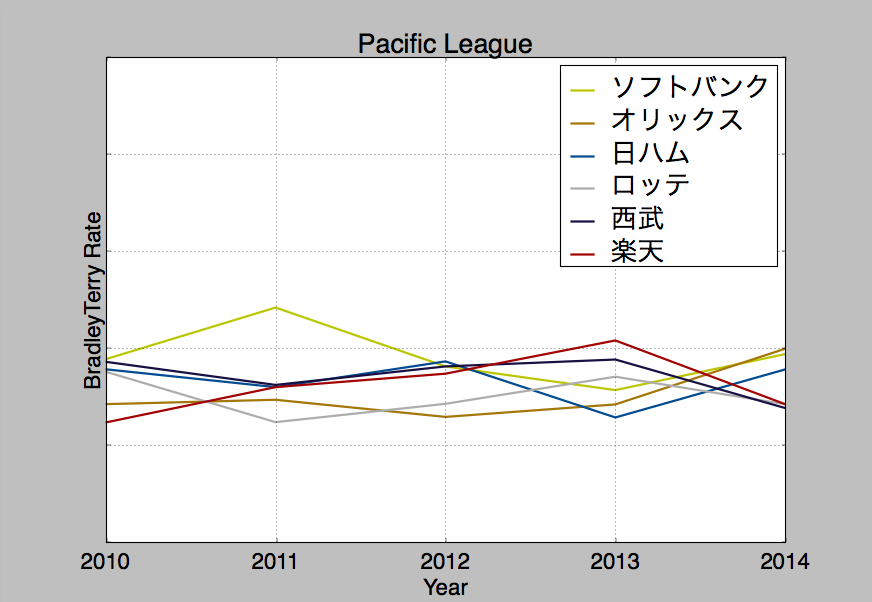
パ・リーグでも同様にやってみると、以下のようなグラフとなります。
セ・リーグのグラフと比較すると6本の折れ線がごちゃごちゃしてるのが特徴的です。
2013年と2014年でABクラスがまるっと入れ替わるということが起きちゃう「混パ」をよく表現できてますね!

