Dockerのモニタリング等って最近はどういうのがあるのかな、と見ていたらcAdvisor(1)を見かけました。
InfluxDB, Grafanaと連携させて可視化もできるようです。(2)
InfluxDB使いたいなー、と思いつつ、直近はprometheusに慣れていきたいので、連携できるか見てみました。
ぐぐってみるとすでに実装している人がいますね。
すなおに写経してみようと思います。
実施順
1. cAdvisorコンテナを起動
sudo docker run -d \
  -v /var/run:/var/run:rw -v /sys:/sys:ro -v /var/lib/docker/:/var/lib/docker:ro \
  -p 8080:8080 --privileged --name=cadvisor_with_influxdb \
  google/cadvisor:latest
2. prometheus.ymlを用意
prometheusがメトリクス収集をするためのエンドポイントを設定します。
ここで、AWS環境を利用していたのでVPCのプライベートIPアドレス、および、1.で指定したcAdvisorの8080ポートを指定しました。
すると、[プライベートIP:8080/metrics]から収集した情報を蓄積・可視化してくれるようです。
prometheus.yml
global:
  scrape_interval: 15s # By default, scrape targets every 15 seconds.
  evaluation_interval: 15s # By default, scrape targets every 15 seconds.
  # scrape_timeout is set to the global default (10s).

  # Attach these extra labels to all time-series collected by this Prometheus instance.
  #labels:
    #monitor: 'panamax-monitor'

rule_files:
  - '/etc/prometheus/alert.rules'

# A scrape configuration containing exactly one endpoint to scrape:
scrape_configs:
# The job name is added as a label `job=<job_name>` to any timeseries scraped from this config.

  # Panamax
  - job_name: 'panamax'
    scrape_interval: 5s

    # Override the global default and scrape targets from this job every 5 seconds.
    scrape_interval: 5s
    scrape_timeout:  3s

    target_groups:
      - targets: ['プライベートIP:8080']
        labels:
          group: 'development'
3. alert.ruleを追加
ここはまだ深堀していません。下記のように丸コピしました。
ALERT pmx_down
  IF up == 0
  FOR 5m
4. prometheusサーバの起動
下記のように起動しました。
alertmanager.urlで、パブリックIPを指定しました。[0.0.0.0]や[localhost]を指定すると怒られました。地味に賢いですね。。
run-prometheus.sh
docker run -i -p 9090:9090 \
              -v $PWD/prometheus.yml:/etc/prometheus/prometheus.yml \
              -v $PWD/alert.rules:/etc/prometheus/alert.rules \
              prom/prometheus \
              -config.file=/etc/prometheus/prometheus.yml \
              -alertmanager.url=http://${AWSのパブリックIP}:9093
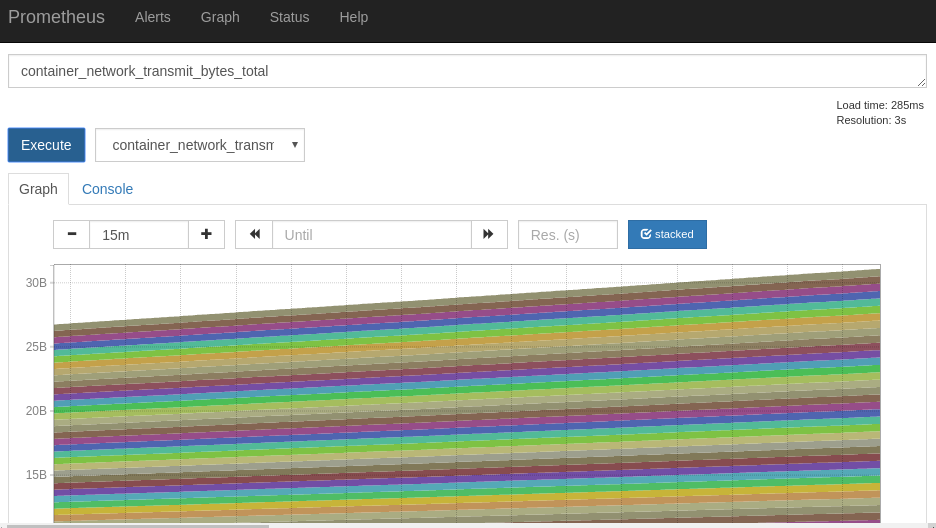
5. UIを見てみた。
4.で指定したUIを参照すると以下のようにメトリクス収集された結果を確認できました。
参考(というかTODO)
- cAdvisorじゃできないこと(マルチホストの収集と可視化)を実装
- prometheusのデータ層等の隔離
- alert設定の方法の確認。https://prometheus.io/docs/alerting/rules/
- exporterという概念もあり、下記のようなコマンドが紹介されています。
docker run -d --name PROM_CON_EXP \
  -p 9104:9104 \
  -v /sys/fs/cgroup:/cgroup -v /var/run/docker.sock:/var/run/docker.sock \
  prom/container-exporter
上記サイトを見ると、他のサードパーティ群に対応したものも多数あるようです。
概念理解と使えそうならごりっと導入もしていきたいところです。
InfluxDBも使ってみたい