備忘となります。
remove処理を入れないと、ずんずんずんずん図形が黒ずんでいきます。。
<!DOCTYPE html>
<html>

<head>
    <meta charset="utf-8">
    <title>Line Chart</title>
    <style>
        svg {
            width: 380px;
            height: 240px;
            border: 1px solid skyblue;
        }
        .line {
            fill: none;
            stroke: black;
        }
        .axis text {
            font-family: sans-serif;
            font-size: 11px;
        }
        .axis path,
        .alis line {
            fill: none;
            stroke: black;
        }
        .axis_x line {
            fill: none;
            stroke: black;
        }
    </style>
    <script src="http://d3js.org/d3.v3.min.js" charset="utf-8"></script>
</head>

<body>
    <h1>Line Chart</h1>
    <svg id="myGraph"></svg>
    <script src="js/line_chart.js"></script>
</body>

</html>
line_chart.js
var svgWidth = 320;
var svgHeight = 240;
var offsetX = 30;
var offsetY = 20;
var scale = 2.0;
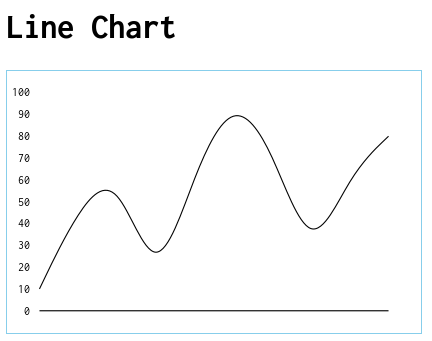
var dataSet1 = [10, 47, 65, 8, 64, 99, 75, 22, 63, 80];
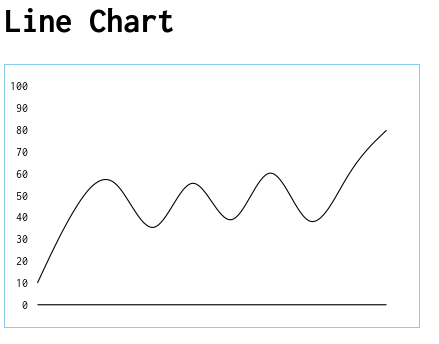
var dataSet2 = [10, 48, 67, 18, 74, 20, 80, 22, 63, 80];
var margin = svgWidth / (dataSet1.length - 1);
var t = 0;
var x = 0;
var yScale = d3.scale.linear()
.domain([0, 100])
.range([scale * 100, 0])
d3.select("#myGraph")
.append("g")
.attr("class", "axis")
.attr("transform", "translate(" + offsetX + ", " + offsetY + ")")
.call(
d3.svg.axis()
.scale(yScale)
.orient("left")
)
d3.select("#myGraph")
.append("rect")
.attr("class", "axis_x")
.attr("width", svgWidth)
.attr("height", 1)
.attr("transform", "translate(" + offsetX + ", " + (svgHeight - offsetY - 0.5) + ")")
function draw(dataSet) {
var line = d3.svg.line()
.x(function(d, i) {
return offsetX + i * margin;
})
.y(function(d, i) {
return svgHeight - (d * scale) - offsetY;
})
.interpolate("basis")
var lineElements = d3.selectAll("#myGraph")
.append("path")
.attr("class", "line")
.attr("d", line(dataSet))
}
d3.timer(function() {
if (t > 1.0) {
console.log(t);
t = 0
x += 1;
if (x % 2 == 0) {
d3.selectAll("path").remove();
draw(dataSet1)
} else {
d3.selectAll("path").remove();
draw(dataSet2)
}
}
t += 0.02;
下記のような図が交互に繰り返され続けます。おー。