背景
- react-chartjsはChart.jsを使ったReactコンポーネント
- react-chartjsが対応しているChart.jsの最新バージョンはv1.1.1
- Chart.jsが積み上げ棒グラフに対応したのはv2から
react-chartjsからChart.js v2が使えないと積み上げ棒グラフが書けません。
作戦
reacth-chartjsはchartjs-v2ブランチでChart.js v2対応版を開発中です。
これを使って積み上げ棒グラフを表示します。
ゴール
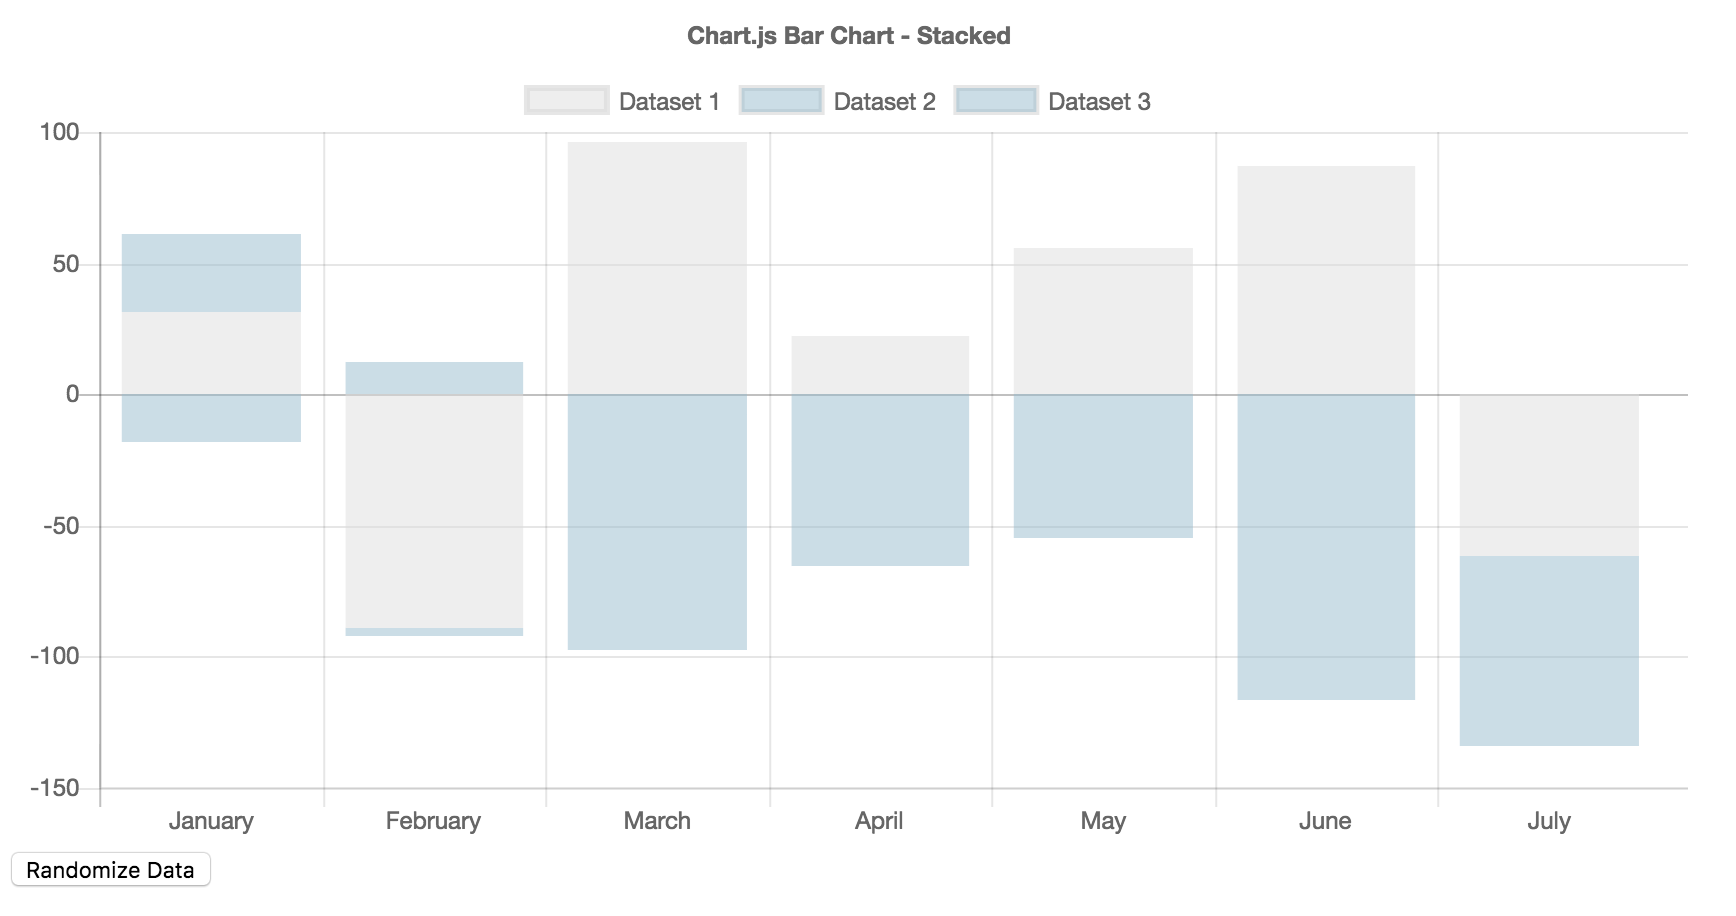
Chart.jsのサンプルがあります。
これと同じグラフを表示します。
手段
index.jsx
index.jsx
const React = require('react')
const ReactDOM = require('react-dom')
const {Bar} = require("react-chartjs")

const chartData = {
  labels: [
    "January",
    "February",
    "March",
    "April",
    "May",
    "June",
    "July"
  ],
  datasets: [
    {
      label: 'Dataset 1',
      backgroundColor: "rgba(220,220,220,0.5)",
      data: [
        randomScalingFactor(),
        randomScalingFactor(),
        randomScalingFactor(),
        randomScalingFactor(),
        randomScalingFactor(),
        randomScalingFactor(),
        randomScalingFactor()
      ]
    }, {
      label: 'Dataset 2',
      backgroundColor: "rgba(151,187,205,0.5)",
      data: [
        randomScalingFactor(),
        randomScalingFactor(),
        randomScalingFactor(),
        randomScalingFactor(),
        randomScalingFactor(),
        randomScalingFactor(),
        randomScalingFactor()
      ]
    }, {
      label: 'Dataset 3',
      backgroundColor: "rgba(151,187,205,0.5)",
      data: [
        randomScalingFactor(),
        randomScalingFactor(),
        randomScalingFactor(),
        randomScalingFactor(),
        randomScalingFactor(),
        randomScalingFactor(),
        randomScalingFactor()
      ]
    }
  ]
}

const chartOption = {
  title: {
    display: true,
    text: "Chart.js Bar Chart - Stacked"
  },
  tooltips: {
    mode: 'label'
  },
  responsive: true,
  scales: {
    xAxes: [
      {
        stacked: true
      }
    ],
    yAxes: [
      {
        stacked: true
      }
    ]
  }
}

const App = () => <Bar data={chartData} options={chartOption} width="600" height="250" onClick={this.handleClick} ref={(ref) => this.Bar = ref}/>

ReactDOM.render(
  <App/>, document.querySelector('#container'))

function randomScalingFactor() {
  return (Math.random() > 0.5
    ? 1.0
    : -1.0) * Math.round(Math.random() * 100)
}

function randomColorFactor() {
  return Math.round(Math.random() * 255)
}
index.html
index.html
<!DOCTYPE html>
<html>
  <body>
    <div id="container">
    </div>
    <script src="bundle.js"></script>
  </body>
</html>
ビルド
babelの設定ファイルを作ります。
.babelrc
{
  "plugins": ["transform-react-jsx"]
}
browserifyでビルドします。
npm init -y
npm i -D browserify babelify babel-plugin-transform-react-jsx react react-dom chart.js
npm i -D react-chartjs@git://github.com/jhudson8/react-chartjs.git#chartjs-v2
node_modules/browserify/bin/cmd.js -t babelify index.jsx -o bundle.js
react-chartjsのインストール時にgitのブランチを指定します。
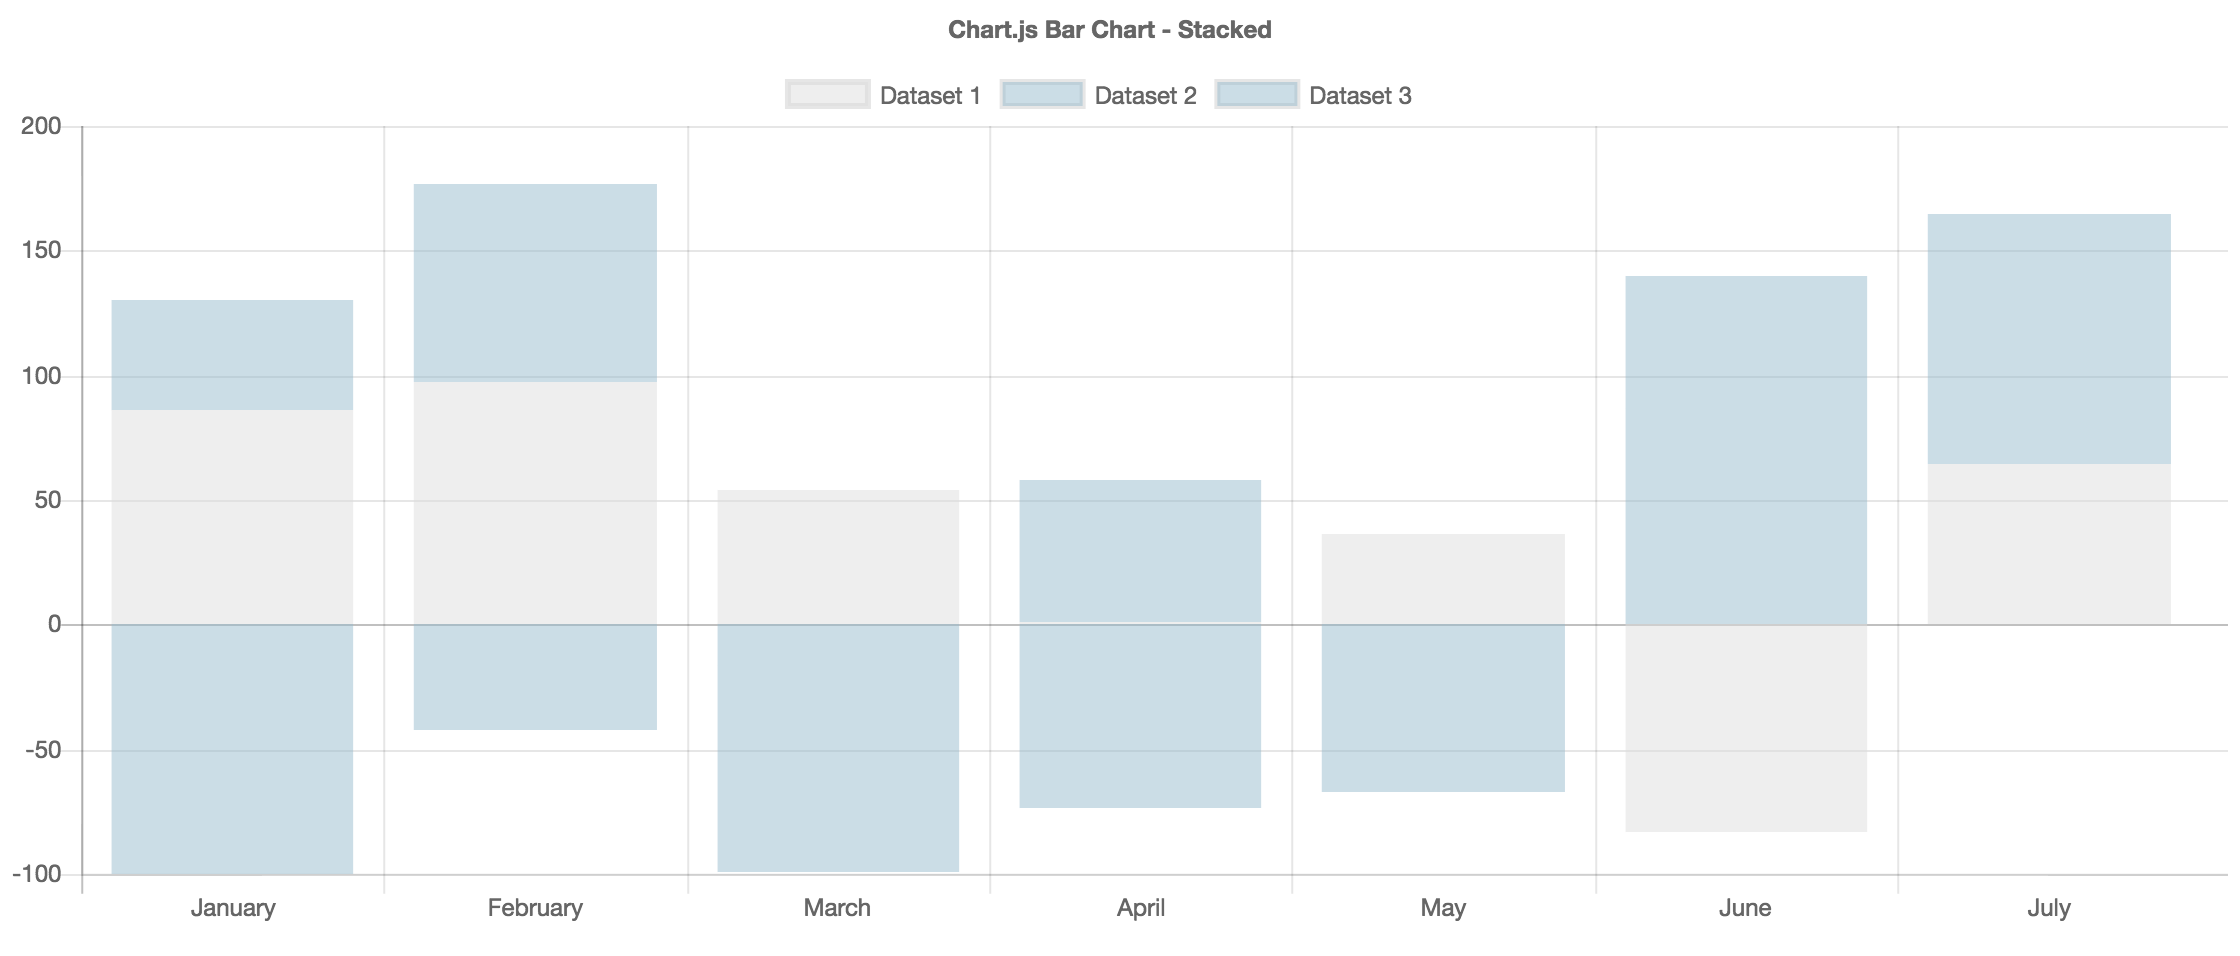
結果
index.htmlを開くと、次のグラフが表示されます。

