せっかくMendeley APIを触れるようになったので、論文情報を取り出して解析したいと思います。
コード
ライブラリ
require(httr)
require(rjson)
require(RCurl)
require(dplyr)
library(tm)
library(proxy)
アクセストークンを取得する
例のごとくMendeley APIのアクセストークンを手に入れてください。
一番簡単な方法は以下を参考にしてください。
お手軽にMendeley APIを叩く方法
access_token <- "アクセストークン"
検索APIを使って論文情報を取得する
検索方法を細かく指定したい時はhttps://api.mendeley.com/apidocs/docs#!/documents_2/search から入力した後、Try it out!ボタンを押したときに出てくるRequest URLをapiとして使用してください。
api <- "https://api.mendeley.com/search/catalog?source=journal&abstract=plasma%20medicine&open_access=false&limit=100"

doc_rsp <- GET(api,
               add_headers(
                 'Authorization' = paste("Bearer", access_token),
                 'Content-Type' = 'application/vnd.mendeley-document.1+json'
               )
)
取り出した論文情報を処理してアブスト情報から単語の出現頻度を計算する
docs <- doc_rsp %>%
  httr::content(.) %>%
  rawToChar %>%
  fromJSON

docs <- docs %>% #ダブっているのでタイトルが重なっているものを取り除く
  sapply(function(x) x$title) %>%
  toupper %>%
  {function(x) !duplicated(x)}() %>%
  docs[.]

absts <- docs %>%
  sapply(function(x) x$abstract) %>%
  VectorSource %>%
  Corpus

dtm <- absts %>% DocumentTermMatrix
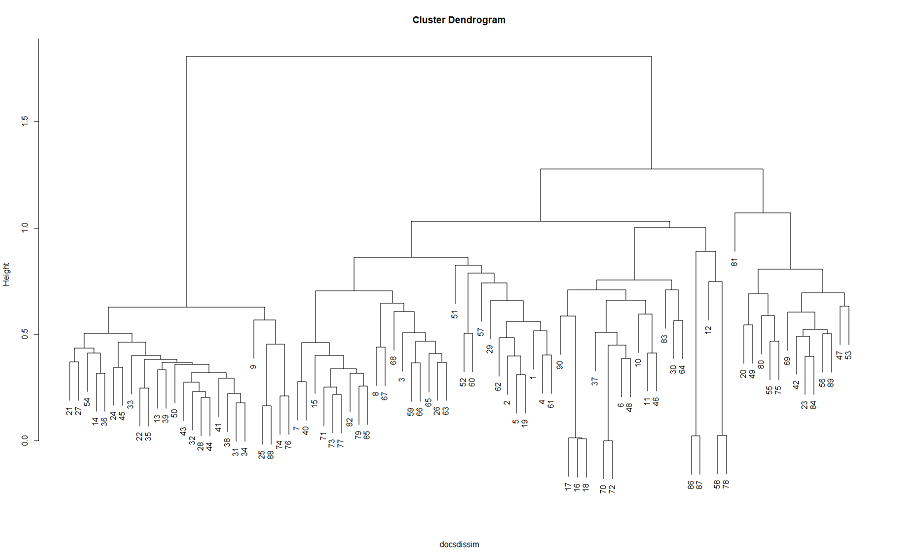
単語の頻度情報からアブスト同士の距離を計算
docsdissim <- dtm %>% as.matrix %>% dist(method = "cosine")

h <- hclust(docsdissim, method = "ward.D2")
plot(h, sub = "")