pandas の to_excel を使って、データフレームをエクセルに書き出します。
- [pandas.DataFrame.to_excel — pandas 0.15.1
documentation](http://pandas.pydata.org/pandas-
docs/version/0.15.1/generated/pandas.DataFrame.to_excel.html)
まずは、必要な Python モジュールがインポートできることを確認します。
import pandas as pd
import matplotlib.pyplot as plt
from pandas.io import wb
import xlsxwriter
データの読み込み
世界銀行の API を使って、アメリカと日本の人口とGDPを取得します。indicator 文字列は世界銀行の API から取得します。
df_gdp = wb.download(indicator='NY.GDP.PCAP.KD', country=['US', 'JP'], start=1960, end=2013)
df_population = wb.download(indicator='SP.POP.TOTL', country=['US', 'JP'], start=1960, end=2013)
データの確認
df_gdp.head(3)
| NY.GDP.PCAP.KD | ||
|---|---|---|
| country | year | |
| Japan | 2013 | 37432.840747 |
| 2012 | 36800.922307 | |
| 2011 | 36203.430066 |
df_gdp.dtypes
NY.GDP.PCAP.KD    float64
dtype: object
df_gdp.index

MultiIndex(levels=[['Japan', 'United States'], ['1960', '1961', '1962', '1963', '1964', '1965', '1966', '1967', '1968', '1969', '1970', '1971', '1972', '1973', '1974', '1975', '1976', '1977', '1978', '1979', '1980', '1981', '1982', '1983', '1984', '1985', '1986', '1987', '1988', '1989', '1990', '1991', '1992', '1993', '1994', '1995', '1996', '1997', '1998', '1999', '2000', '2001', '2002', '2003', '2004', '2005', '2006', '2007', '2008', '2009', '2010', '2011', '2012', '2013']],
           labels=[[0, 0, 0, 0, 0, 0, 0, 0, 0, 0, 0, 0, 0, 0, 0, 0, 0, 0, 0, 0, 0, 0, 0, 0, 0, 0, 0, 0, 0, 0, 0, 0, 0, 0, 0, 0, 0, 0, 0, 0, 0, 0, 0, 0, 0, 0, 0, 0, 0, 0, 0, 0, 0, 0, 1, 1, 1, 1, 1, 1, 1, 1, 1, 1, 1, 1, 1, 1, 1, 1, 1, 1, 1, 1, 1, 1, 1, 1, 1, 1, 1, 1, 1, 1, 1, 1, 1, 1, 1, 1, 1, 1, 1, 1, 1, 1, 1, 1, 1, 1, ...], [53, 52, 51, 50, 49, 48, 47, 46, 45, 44, 43, 42, 41, 40, 39, 38, 37, 36, 35, 34, 33, 32, 31, 30, 29, 28, 27, 26, 25, 24, 23, 22, 21, 20, 19, 18, 17, 16, 15, 14, 13, 12, 11, 10, 9, 8, 7, 6, 5, 4, 3, 2, 1, 0, 53, 52, 51, 50, 49, 48, 47, 46, 45, 44, 43, 42, 41, 40, 39, 38, 37, 36, 35, 34, 33, 32, 31, 30, 29, 28, 27, 26, 25, 24, 23, 22, 21, 20, 19, 18, 17, 16, 15, 14, 13, 12, 11, 10, 9, 8, ...]],
           names=['country', 'year'])
df_gdp.describe()
| NY.GDP.PCAP.KD | |
|---|---|
| count | 108.000000 |
| mean | 28015.188967 |
| std | 10061.123534 |
| min | 7079.439251 |
| 25% | 20152.131354 |
| 50% | 28858.039661 |
| 75% | 35165.327764 |
| max | 45863.019564 |
GDP のデータフレームは:
- "country" と "year" のマルチインデックスになっている
- 108個の要素がある
- 最小値は 7079.439251、最大値は 45863.019564 になっている
- データは最新のものから降順になっている
人口のデータフレームも同じような構成になっています。
データを整形
このままでは使いにくいのでデータを整形します。
df_gdp.unstack(level=0).head(3)
| NY.GDP.PCAP.KD | ||
|---|---|---|
| country | Japan | United States |
| year | ||
| 1960 | 7079.439251 | 15469.072967 |
| 1961 | 7728.000388 | 15564.690585 |
| 1962 | 8338.409056 | 16262.092906 |
df_gdp.unstack(level=0).describe()
| NY.GDP.PCAP.KD | ||
|---|---|---|
| Japan | United States | |
| count | 54.000000 | 54.000000 |
| mean | 25134.970999 | 30895.406935 |
| std | 9716.583553 | 9646.035006 |
| min | 7079.439251 | 15469.072967 |
| 25% | 17457.921985 | 22981.450242 |
| 50% | 26005.632842 | 30462.082595 |
| 75% | 33991.192095 | 40658.654684 |
| max | 37432.840747 | 45863.019564 |
df_gdp.unstack(level=0).plot(figsize=(16, 4), colormap='seismic')
人口のデータも同様に変換します。
df_population.unstack(level=0).head(3)
| SP.POP.TOTL | ||
|---|---|---|
| country | Japan | United States |
| year | ||
| 1960 | 92500572 | 180671000 |
| 1961 | 94943000 | 183691000 |
| 1962 | 95832000 | 186538000 |
ax = df_population.unstack(level=0).plot(figsize=(16, 4), colormap='seismic')
5年の移動平均を計算してみると、アメリカは人口増加、日本は人口横ばいである傾向が少しハッキリします。
ax = pd.stats.moments.rolling_mean(df_population.unstack(level=0), 5).plot(figsize=(16, 4), colormap='seismic')
ax = pd.stats.moments.rolling_std(df_population.unstack(level=0)['SP.POP.TOTL'], 5).plot(figsize=(16, 4), colormap='seismic')
データの結合
2つのデータフレームを結合します。
pd.concat([df_gdp, df_population], axis=1).unstack(level=0).head(3)
| NY.GDP.PCAP.KD | SP.POP.TOTL | |||
|---|---|---|---|---|
| country | Japan | United States | Japan | United States |
| year | ||||
| 1960 | 7079.439251 | 15469.072967 | 92500572 | 180671000 |
| 1961 | 7728.000388 | 15564.690585 | 94943000 | 183691000 |
| 1962 | 8338.409056 | 16262.092906 | 95832000 | 186538000 |
df = pd.concat([df_gdp, df_population], axis=1).unstack(level=0)
df.describe()
| NY.GDP.PCAP.KD | SP.POP.TOTL | |||
|---|---|---|---|---|
| Japan | United States | Japan | United States | |
| count | 54.000000 | 54.000000 | 5.400000e+01 | 5.400000e+01 |
| mean | 25134.970999 | 30895.406935 | 1.171442e+08 | 2.460156e+08 |
| std | 9716.583553 | 9646.035006 | 1.115320e+07 | 4.038823e+07 |
| min | 7079.439251 | 15469.072967 | 9.250057e+07 | 1.806710e+08 |
| 25% | 17457.921985 | 22981.450242 | 1.085998e+08 | 2.123952e+08 |
| 50% | 26005.632842 | 30462.082595 | 1.217915e+08 | 2.412110e+08 |
| 75% | 33991.192095 | 40658.654684 | 1.268150e+08 | 2.813818e+08 |
| max | 37432.840747 | 45863.019564 | 1.278173e+08 | 3.161288e+08 |
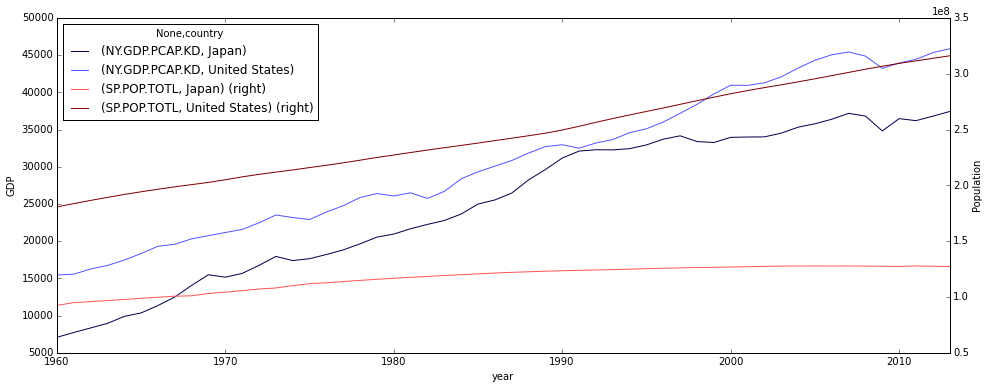
GDPを左軸、人口を右軸にしてグラフを描画してみます。
ax = df.plot(figsize=(16, 6), colormap='seismic',
                 secondary_y=[('SP.POP.TOTL', 'Japan'), ('SP.POP.TOTL', 'United States')])
    ax.set_ylabel('GDP')
    _ = ax.right_ax.set_ylabel('Population')
単一のデータフレームで扱えるようになりました。
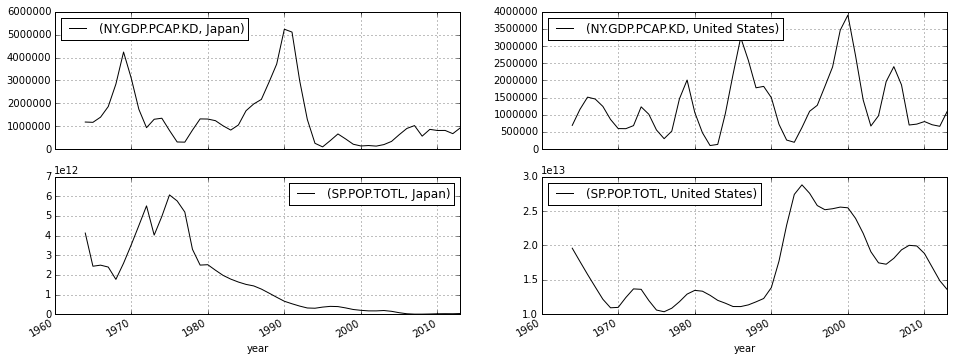
5年単位での分散を計算すると、日本の人口は1980年ごろから伸び悩み、GDPは1995年ごろから横ばいと言えます。
アメリカの場合は、1990年ごろに人口増加の波があり、2000年ごろにGDPの増加がピークを迎え、定期的に波があると言えます。
ax = pd.stats.moments.rolling_var(df, 5).plot(subplots=True, layout=(2, 2), figsize=(16, 6))
データの出力
エクセルに出力します。データフレームのメソッドを呼び出しますが、xlsxwriter
などのエクセル書き出しモジュールがインストールされている必要があります。
df.to_excel('/data/sample.xlsx', sheet_name='Japan_US')
%ls /data
sample.xlsx
出来上がったデータをエクセルで開いてみてください。LibreOffice などでも構いません。
複数のデータフレームを個別のシートに書き出す場合は、引数にファイル名ではなくライターオブジェクト (ExcelWriter )
を指定します。公式ドキュメントに例がありますが、詳しくは Stack Overflow などで探しましょう。
- [pandas.DataFrame.to_excel — pandas 0.15.1
documentation](http://pandas.pydata.org/pandas-
docs/stable/generated/pandas.DataFrame.to_excel.html) - [creating multiple excel worksheets using data in a pandas dataframe - Stack
Overflow](http://stackoverflow.com/questions/21981820/creating-multiple-excel-
worksheets-using-data-in-a-pandas-dataframe)
動作環境
version_information 拡張を有効にしてあります。このノートブックの動作環境は以下のものです。
%version_information numpy, pandas, matplotlib, xlsxwriter
| Software | Version |
|---|---|
| Python | 3.4.2 64bit [GCC 4.9.1] |
| IPython | 2.3.1 |
| OS | Linux 3.13.0 24 generic x86_64 with debian 8.0 |
| numpy | 1.9.1 |
| pandas | 0.15.1 |
| matplotlib | 1.4.2 |
| xlsxwriter | 0.6.4 |
| Mon Dec 08 15:50:50 2014 UTC | |
※ このドキュメントは IPython Notebook を Markdown に変換して微調整したものです。
$ ipython nbconvert --to markdown /data/worldbank_to_excel.ipynb


