データベースに保存してあるデータを見るときに、結果を再集計したりグラフで確認できると便利です。また、そのときにデータから読み取ったこと、考えたことをメモしておけるとチームで共有できるようになります。
専用のダッシュボードを作る程でもないけれど、という規模のときは、Jupyter Notebook をフロントエンドとして使うと便利です。
実行環境の用意
Docker を使ってテスト環境を用意します。Jupyter (jupyter/datascience-notebook) と PostgreSQL (postgres) の2つのイメージを使います。
まずは PostgreSQL を立ち上げて、Jupyter はそれにリンクさせます。テストデータは後述の pagila を使いますので、データベース名もそれに合わせておきます。公式の Docker イメージでは、環境変数を与えることで設定できます。
| 項目 | 内容 |
|---|---|
| コンテナ名 | db |
| データベース名 | pagila |
| データベースの接続ユーザー名 | nbuser |
| データベースの接続ユーザーのパスワード | nbuser_secret |
$ docker run -d --name=db \
             -e POSTGRES_DB=pagila \
             -e POSTGRES_USER=nbuser \
             -e POSTGRES_PASSWORD=nbuser_secret \
             postgres:9.5
次に、Notebook を8080番ポートで起動します。データベースの接続情報を環境変数から取得できるように、データベースのコンテナにリンクしておきます。リンクしておくと、ホスト名もそのまま参照できます。
$ docker run -d --name=notebook \
             -p 8080:8888 \
             --link=db:db \
             jupyter/datascience-notebook
なお、接続情報は実際に実行する環境に応じて設定しましょう。また、Notebook から接続するユーザーは読み込み専用の権限にしておくと、不意にデータを破壊してしまう間違いを防止できます。
テストデータの用意
PostgreSQL 公式 Wiki の Sample Databases にいくつかの記載があります。この中で、MySQL で使われている Sakila Sample Database を移植した pagila を使ってみます。pagila では、テーブル構造 (pagila-schema.sql) とデータ (pagila-data.sql または pagila-insert-data.sql) の2つの SQL ファイルを実行します。
リポジトリからファイルを取得し、作業用のコンテナを起動してリポジトリの内容をマウントします。
$ git clone https://github.com/devrimgunduz/pagila.git
$ cd pagila
$ git checkout pagila-0.11.0
$ cd -

$ docker run --rm -it --link=db:db \
             -v `pwd`/pagila:/tmp/pagila \
             -u postgres \
             postgres:9.5 /bin/bash
コンテナ内では、接続情報をパスワードファイルに記載し、 psql コマンドを使って SQL ファイルの内容を実行します。コンテナを起動するときに db コンテナにリンクしてありますので、 "DB_ENV_" から始まる環境変数で文字列を参照できます。コマンドの表記は長くなりますが、ハードコードする内容がなくなる点は便利です。
$ export PGPASSFILE=/tmp/.pgpass
$ echo "db:$DB_PORT_5432_TCP_PORT:$DB_ENV_POSTGRES_DB:$DB_ENV_POSTGRES_USER:$DB_ENV_POSTGRES_PASSWORD" > $PGPASSFILE
$ chmod 600 $PGPASSFILE

$ psql -h db -U $DB_ENV_POSTGRES_USER -d $DB_ENV_POSTGRES_DB < /tmp/pagila/pagila-schema.sql
$ psql -h db -U $DB_ENV_POSTGRES_USER -d $DB_ENV_POSTGRES_DB < /tmp/pagila/pagila-data.sql
データ登録が終わったら psql コマンドで接続してテーブル内のデータを確認してみると良いでしょう。
pagila=# \dt
              List of relations
 Schema |       Name       | Type  |  Owner
--------+------------------+-------+----------
 public | actor            | table | postgres
 public | address          | table | postgres
 public | category         | table | postgres
 public | city             | table | postgres
 public | country          | table | postgres
 public | customer         | table | postgres
 public | film             | table | postgres
 public | film_actor       | table | postgres
 public | film_category    | table | postgres
 public | inventory        | table | postgres
 public | language         | table | postgres
 public | payment          | table | postgres
 public | payment_p2015_01 | table | postgres
 public | payment_p2015_02 | table | postgres
 public | payment_p2015_03 | table | postgres
 public | payment_p2015_04 | table | postgres
 public | payment_p2015_05 | table | postgres
 public | payment_p2015_06 | table | postgres
 public | rental           | table | postgres
 public | staff            | table | postgres
 public | store            | table | postgres
(21 rows)

pagila=# select * from actor order by actor_id limit 10;
 actor_id | first_name |  last_name   |     last_update
----------+------------+--------------+---------------------
        1 | PENELOPE   | GUINESS      | 2016-02-15 09:34:33
        2 | NICK       | WAHLBERG     | 2016-02-15 09:34:33
        3 | ED         | CHASE        | 2016-02-15 09:34:33
        4 | JENNIFER   | DAVIS        | 2016-02-15 09:34:33
        5 | JOHNNY     | LOLLOBRIGIDA | 2016-02-15 09:34:33
        6 | BETTE      | NICHOLSON    | 2016-02-15 09:34:33
        7 | GRACE      | MOSTEL       | 2016-02-15 09:34:33
        8 | MATTHEW    | JOHANSSON    | 2016-02-15 09:34:33
        9 | JOE        | SWANK        | 2016-02-15 09:34:33
       10 | CHRISTIAN  | GABLE        | 2016-02-15 09:34:33
(10 rows)
Jupyter Notebook にライブラリをインストール
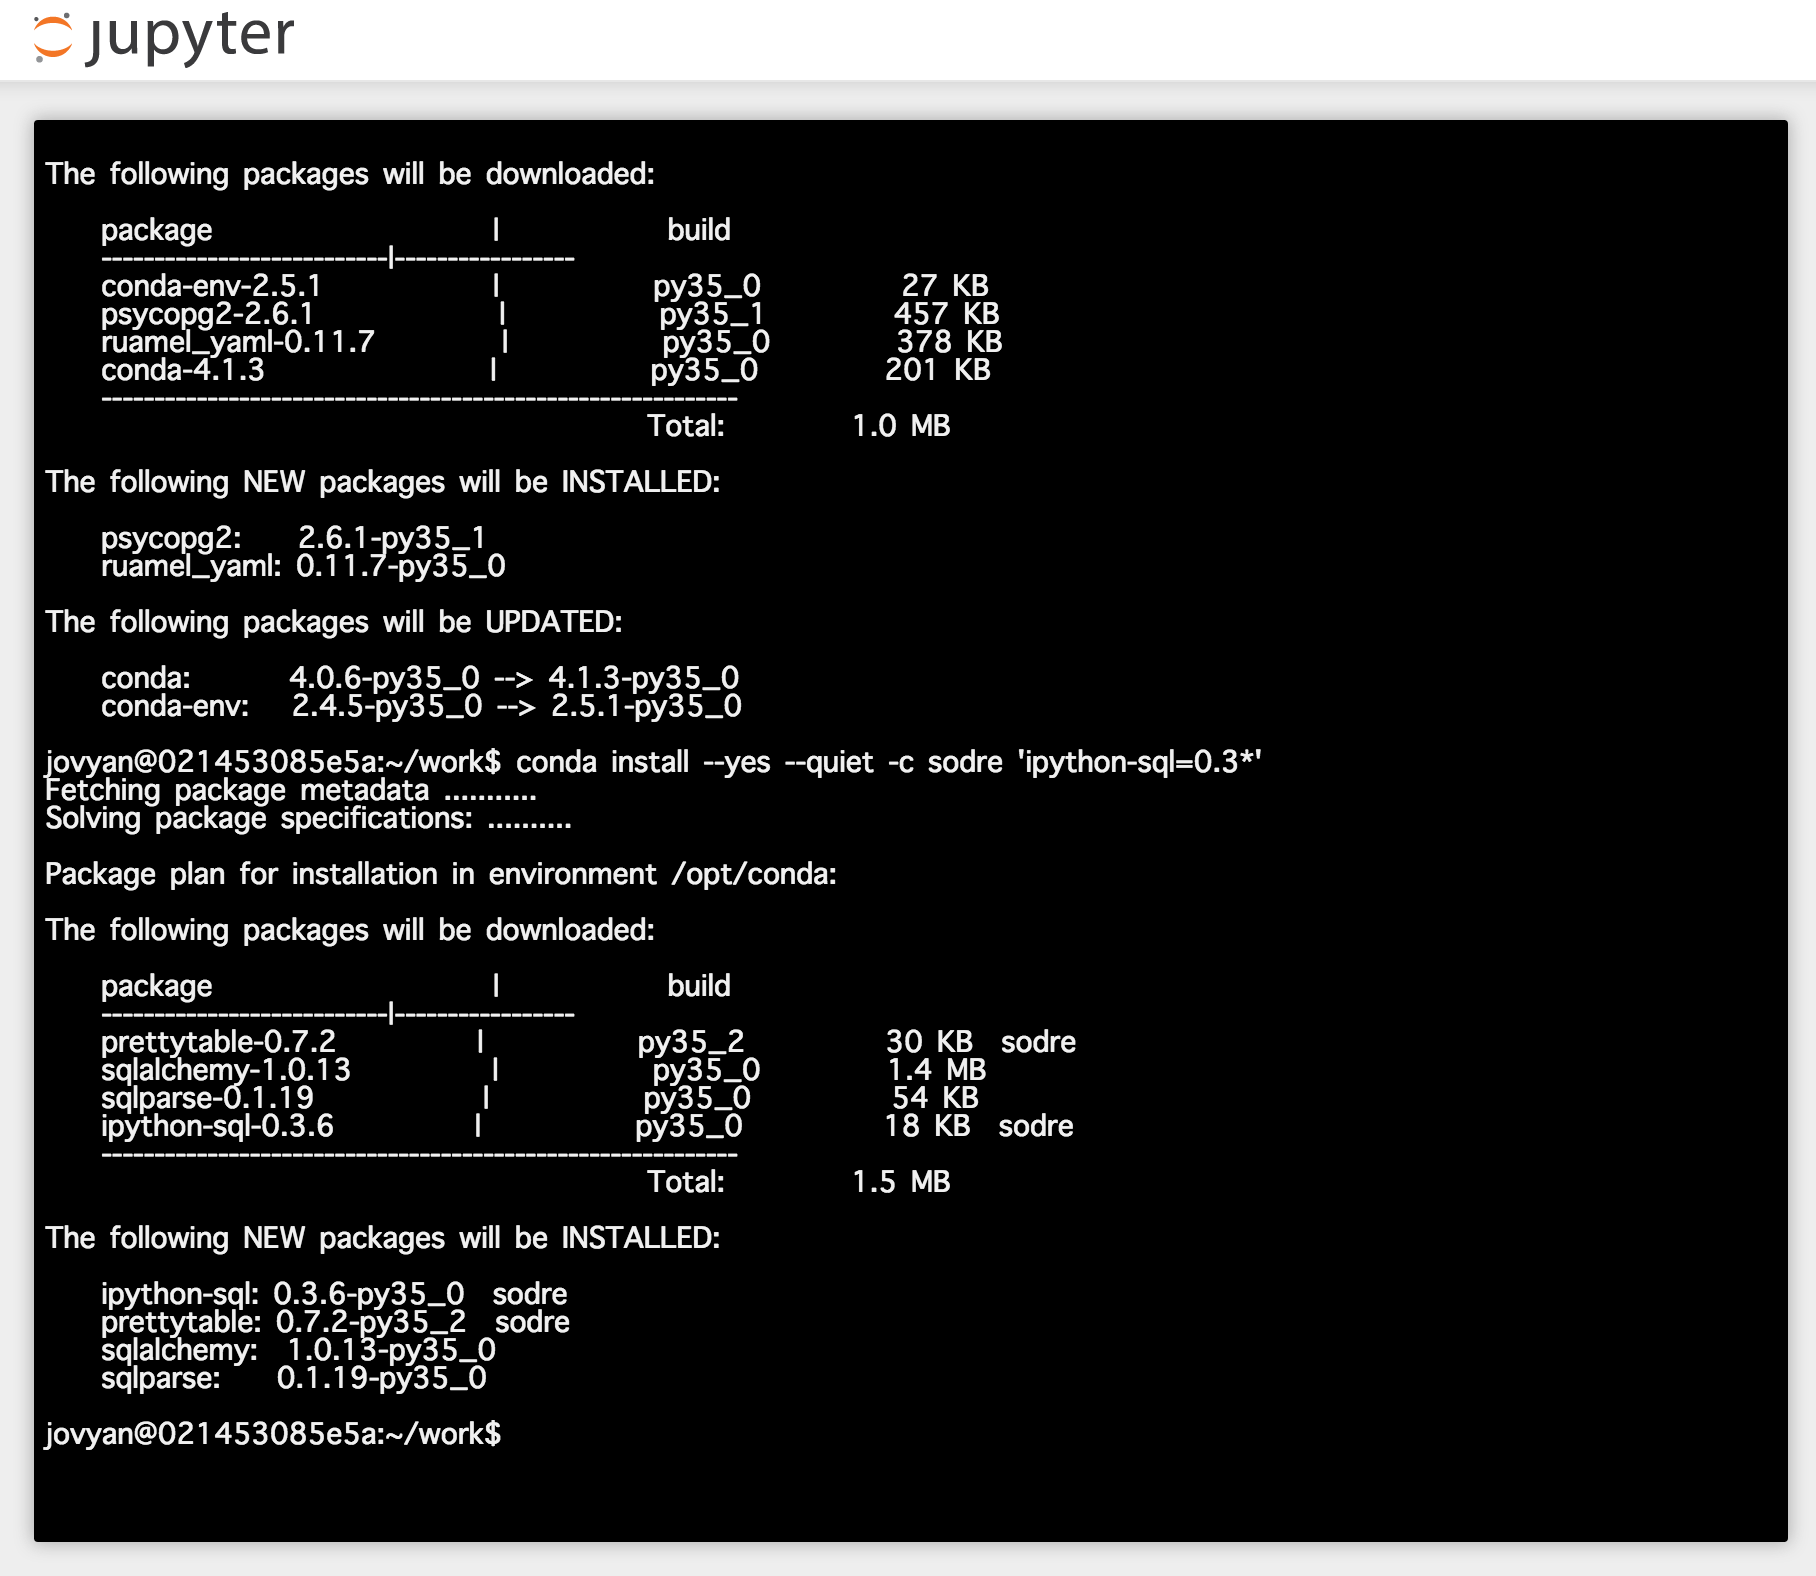
Notebook を起動したポート番号にブラウザでアクセスします。上記の手順では8080番ポートで起動しています。次に、Jupyter のターミナルを起動し、PostgreSQL 用に psycopg2 と、SQL の簡易実行用に ipython-sql をインストールします。
- Psycopg – PostgreSQL database adapter for Python
- %%sql magic for IPython, hopefully evolving into full SQL client
$ conda install --yes --quiet 'psycopg2=2.6*'
$ conda install --yes --quiet -c sodre 'ipython-sql=0.3*'
ターミナルを閉じて、Python3 のノートブックを新規作成しましょう。
Jupyter Notebook からデータベースに接続
それでは、ノートブックからデータベースに接続してみます。
import os
import psycopg2

pgconfig = {
    'host': 'db',
    'port': os.environ['DB_PORT_5432_TCP_PORT'],
    'database': os.environ['DB_ENV_POSTGRES_DB'],
    'user': os.environ['DB_ENV_POSTGRES_USER'],
    'password': os.environ['DB_ENV_POSTGRES_PASSWORD'],
}
conn = psycopg2.connect(**pgconfig)
cur = conn.cursor()
cur.execute("SELECT * FROM actor;")
cur.fetchone()
(1, 'PENELOPE', 'GUINESS', datetime.datetime(2016, 2, 15, 9, 34, 33))
cur.fetchone()
(2, 'NICK', 'WAHLBERG', datetime.datetime(2016, 2, 15, 9, 34, 33))
cur.close()
conn.close()
普通の Python スクリプトが動くことを確認できました。
次に、 ipython-sql を使い、SQL の実行結果をそのまま確認してみます。
%load_ext sql
dsl = 'postgres://{user}:{password}@{host}:{port}/{database}'.format(**pgconfig)
%sql $dsl
'Connected: nbuser@pagila'
%%sql
select * from actor order by actor_id limit 10
実行結果は表形式で表示されます。
| actor_id | first_name | last_name | last_update | |
|---|---|---|---|---|
| 0 | 1 | PENELOPE | GUINESS | 2016-02-15 09:34:33 |
| 1 | 2 | NICK | WAHLBERG | 2016-02-15 09:34:33 |
| 2 | 3 | ED | CHASE | 2016-02-15 09:34:33 |
| 3 | 4 | JENNIFER | DAVIS | 2016-02-15 09:34:33 |
| 4 | 5 | JOHNNY | LOLLOBRIGIDA | 2016-02-15 09:34:33 |
| 5 | 6 | BETTE | NICHOLSON | 2016-02-15 09:34:33 |
| 6 | 7 | GRACE | MOSTEL | 2016-02-15 09:34:33 |
| 7 | 8 | MATTHEW | JOHANSSON | 2016-02-15 09:34:33 |
| 8 | 9 | JOE | SWANK | 2016-02-15 09:34:33 |
| 9 | 10 | CHRISTIAN | GABLE | 2016-02-15 09:34:33 |
SqlMagic.autopandas パラメータを True に設定しておくと、結果セットを pandas の DataFrame として処理してくれます。
%config SqlMagic.autopandas = True
df = %sql select * from actor order by actor_id
df.describe()
| actor_id | |
|---|---|
| count | 200.000000 |
| mean | 100.500000 |
| std | 57.879185 |
| min | 1.000000 |
| 25% | 50.750000 |
| 50% | 100.500000 |
| 75% | 150.250000 |
| max | 200.000000 |
単純なデータ取得だけではなく、少し複雑な SQL も正常に処理してくれます。内部的には sqlalchemy を経由して SQL をそのまま実行しています。
%%sql
WITH store_inv AS (
    SELECT store_id, COUNT(*) AS inventory_cnt, COUNT(DISTINCT film_id) AS film_cnt
    FROM inventory GROUP BY 1
), store_staff AS (
    SELECT store_id, COUNT(*) AS staff_cnt
    FROM staff GROUP BY 1
), store_customer AS (
    SELECT store_id, COUNT(*) AS customer_cnt, SUM(active) AS active_customer_cnt
    FROM customer GROUP BY 1
)
SELECT store.store_id, addr.address, addr.district, city.city, country.country,
       store_inv.inventory_cnt, store_inv.film_cnt,
       store_staff.staff_cnt,
       store_customer.customer_cnt, store_customer.active_customer_cnt
  FROM store
       LEFT JOIN address addr USING (address_id)
        LEFT JOIN city USING (city_id)
        LEFT JOIN country USING (country_id)
        LEFT JOIN store_inv USING (store_id)
        LEFT JOIN store_staff USING (store_id)
        LEFT JOIN store_customer USING (store_id)
ORDER BY 1
| store_id | address | district | city | country | inventory_cnt | film_cnt | staff_cnt | customer_cnt | active_customer_cnt | |
|---|---|---|---|---|---|---|---|---|---|---|
| 0 | 1 | 47 MySakila Drive | Alberta | Lethbridge | Canada | 2270 | 759 | 1 | 326 | 318 |
| 1 | 2 | 28 MySQL Boulevard | QLD | Woodridge | Australia | 2311 | 762 | 1 | 273 | 266 |
結果を集計してグラフ描画
結果は pandas のデータフレームとして取得できますので、任意のメソッドを使ってさらに集計できます。また、 matplotlib を使ったグラフ描画も可能です。 jupyter/datascience-notebook のイメージには seaborn も含まれていますので、これを使ってグラフを描いてみましょう。
import seaborn as sns
%matplotlib inline
rental テーブルに商品の貸し出し情報が入っており、貸出日が rental_date 、返却日が return_date に記録されています。商品のIDは inventory_id で、顧客IDは customer_id です。これらを使い、未返却DVDのある顧客数の分布を計算して棒グラフを描画してみます。
df = %sql select * from rental
df.head()
| rental_id | rental_date | inventory_id | customer_id | return_date | staff_id | last_update | |
|---|---|---|---|---|---|---|---|
| 0 | 1 | 2013-05-24 22:53:30 | 367 | 130 | 2013-05-26 22:04:30 | 1 | 2014-02-15 21:30:53 |
| 1 | 2 | 2013-05-24 22:54:33 | 1525 | 459 | 2013-05-28 19:40:33 | 1 | 2015-02-16 02:30:53 |
| 2 | 3 | 2013-05-24 23:03:39 | 1711 | 408 | 2013-06-01 22:12:39 | 1 | 2015-02-16 02:30:53 |
| 3 | 4 | 2013-05-24 23:04:41 | 2452 | 333 | 2013-06-03 01:43:41 | 2 | 2015-02-16 02:30:53 |
| 4 | 5 | 2013-05-24 23:05:21 | 2079 | 222 | 2013-06-02 04:33:21 | 1 | 2015-02-16 02:30:53 |
dt = []
for k in df.keys():
    print('{:20s} : {:,} ({:,})'.format(k, df[k].count(), df[k].nunique()))

## 結果
rental_id            : 16,044 (16,044)
rental_date          : 16,044 (15,815)
inventory_id         : 16,044 (4,580)
customer_id          : 16,044 (599)
return_date          : 15,861 (15,836)
staff_id             : 16,044 (2)
last_update          : 16,044 (3)
16,044件の貸し出し情報があり、商品数は4,580件、顧客数は599人であることが分かります。また、返却日は15,861件ありますので、差し引きすると183件が未返却であると言えます。
返却日が未登録のレコードを顧客IDで集計して顧客ごとの未返却DVDの件数を計算し、さらに件数を集計することで、未返却DVDのある顧客数の分布を計算します。
dd = df[df['return_date'].isnull()].groupby('customer_id').count()[['rental_id',]].reset_index()
dd.groupby('rental_id').count().reset_index().rename(
    columns={'rental_id': 'rental_cnt', 'customer_id': 'customer_cnt'})
| rental_cnt | customer_cnt | |
|---|---|---|
| 0 | 1 | 136 |
| 1 | 2 | 22 |
| 2 | 3 | 1 |
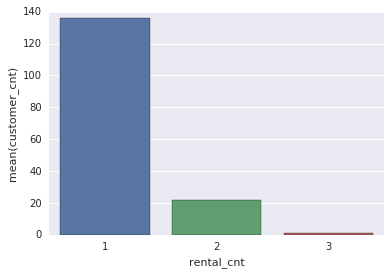
この分布を棒グラフで表現してみます。
d = _
sns.barplot(x='rental_cnt', y='customer_cnt', data=d)
1件だけ未返却DVDのある顧客が多いですが、3件未返却である顧客が一人いることを視覚的にも確認できました。(これくらいなら表の数値を見れば理解できる内容ではありますが)
変数置換を利用したクエリの実行
上記のグラフを見ると、3件未返却である顧客は特殊と言えるかもしれませんので、具体的に個人を特定してみます。
dd[dd['rental_id'] == 3]
| customer_id | rental_id | |
|---|---|---|
| 23 | 75 | 3 |
顧客IDが75の人が対象であることが分かりますので、 customer テーブルで具体的に確認します。このとき、SQL に数値をハードコードするのではなく、 ipython-sql の変数置換を利用できます。
変数置換は、Notebook で普通の変数を定義して、SQL 文で ":" を付けることで参照できます。
customer_id = 75
c = %sql select * from customer where customer_id = :customer_id
c.T
| 0 | |
|---|---|
| customer_id | 75 |
| store_id | 2 |
| first_name | TAMMY |
| last_name | SANDERS |
TAMMY.SANDERS@sakilacustomer.org |
|
| address_id | 79 |
| activebool | True |
| create_date | 2014-02-14 |
| last_update | 2014-02-15 09:57:20 |
| active | 1 |
変数はリストでも受け付けることができますので、特定のIDをハードコードする必要もありません。SQL の WHERE 句では IN を使います。
customers = tuple([int(i) for i in dd[dd['rental_id'] == 3]['customer_id'].tolist()])
c = %sql select * from customer where customer_id in :customers
c.T
もちろん、同じ結果を得られます。
終わりに
Jupyter Notebook から PostgreSQL に接続し、結果をデータフレームで取得できることを確認しました。また、 pandas の機能を使ってデータを加工し、Notebook 上でグラフを描画してみました。データを見ながら考えたことを記録しておけることはとても便利だと思います。
参考:


