Irisのデータをプロットする
有名なアヤメのデータセットを用いて散布図を描いてみます。
まずCSVファイルを用意します。
iris.csv
使用するライブラリ
- numo-gnuplot
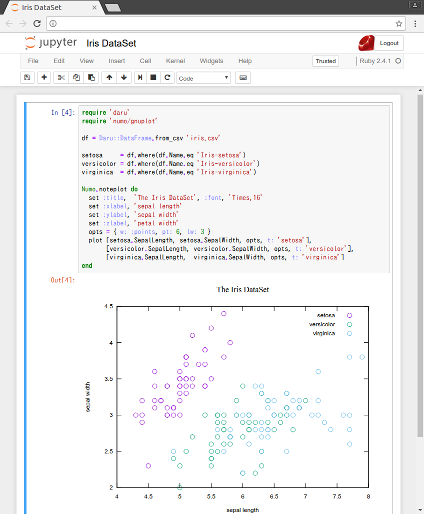
Jupyter Notebookを使うとき
IRuby : Ruby kernel for Jupyter/IPython Notebook
Numo.gnuplot のかわりに Numo.noteplotメソッドを使います。
Numo.noteplot do
  plot "sin(x)"
end
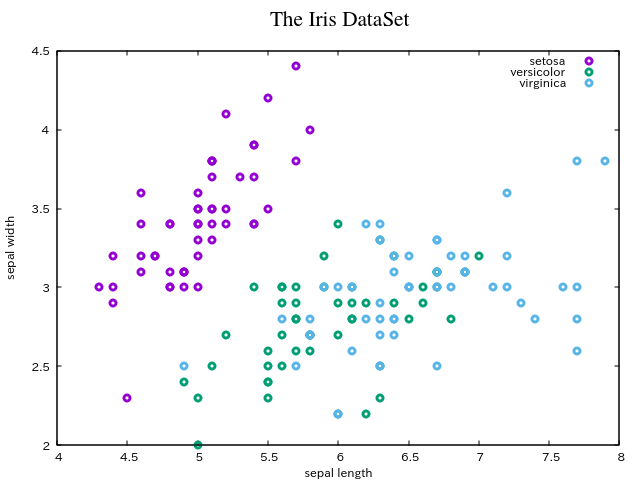
2D散布図
require 'daru'
require 'numo/gnuplot'

df = Daru::DataFrame.from_csv 'iris.csv'

setosa     = df.where(df.Name.eq 'Iris-setosa')
versicolor = df.where(df.Name.eq 'Iris-versicolor')
virginica  = df.where(df.Name.eq 'Iris-virginica')

Numo.gnuplot do
  set :title,  'The Iris DataSet', :font, 'Times,16'
  set :xlabel, 'sepal length'
  set :ylabel, 'sepal width'
  set :zlabel, 'petal width'
  opts = { w: :points, pt: 6, lw: 3 }
  plot [setosa.SepalLength, setosa.SepalWidth, opts, t: 'setosa'],
       [versicolor.SepalLength, versicolor.SepalWidth, opts, t: 'versicolor'],
       [virginica.SepalLength,  virginica.SepalWidth, opts, t: 'virginica']
end

gets # 終了まち
Jupyter Notebook での表示
3D散布図
require 'daru'
require 'numo/gnuplot'

df = Daru::DataFrame.from_csv 'iris.csv'

setosa     = df.where(df.Name.eq 'Iris-setosa')
versicolor = df.where(df.Name.eq 'Iris-versicolor')
virginica  = df.where(df.Name.eq 'Iris-virginica')

Numo.gnuplot do
  set :title,  'The Iris DataSet', :font, 'Times,16'
  set :xlabel, 'sepal length'
  set :ylabel, 'sepal width'
  set :zlabel, 'petal width'
  opts = { w: :points, pt: 6, lw: 3 }
  splot [setosa.SepalLength, setosa.SepalWidth, setosa.PetalWidth,
         opts, t: 'setosa'],
        [versicolor.SepalLength, versicolor.SepalWidth, versicolor.PetalWidth,
         opts, t: 'versicolor'],
        [virginica.SepalLength, virginica.SepalWidth, virginica.PetalWidth,
         opts, t: 'virginica']
end

gets # 終了まち
おまけ gif anime の出力
Gnuplotのfor文ではなく、Rubyのループを使っています。とっても簡単です。
require 'daru'
require 'numo/gnuplot'

df = Daru::DataFrame.from_csv 'iris.csv'

setosa     = df.where(df.Name.eq 'Iris-setosa')
versicolor = df.where(df.Name.eq 'Iris-versicolor')
virginica  = df.where(df.Name.eq 'Iris-virginica')

Numo.gnuplot do
  set :title,  'The Iris DataSet', :font, 'Times,16'
  set :xlabel, 'sepal length'
  set :ylabel, 'sepal width'
  set :zlabel, 'petal width'
  set :term, 'gif animate delay 10'
  set output: "iris.gif"
  opts = { w: :points, pt: 6, lw: 3 }
  60.times do |i|
    set view: "60,#{i*3},1,1"
    splot [setosa.SepalLength, setosa.SepalWidth, setosa.PetalWidth,
           opts, t: 'setosa'],
           [versicolor.SepalLength, versicolor.SepalWidth, versicolor.PetalWidth,
            opts, t: 'versicolor'],
            [virginica.SepalLength, virginica.SepalWidth, virginica.PetalWidth,
             opts, t: 'virginica']
  end
end