cf: http://rpubs.com/dichika/ggplot2_shape
cf: http://blog.goo.ne.jp/r-de-r/e/29758f8210d278bcf4d0599664621fd2
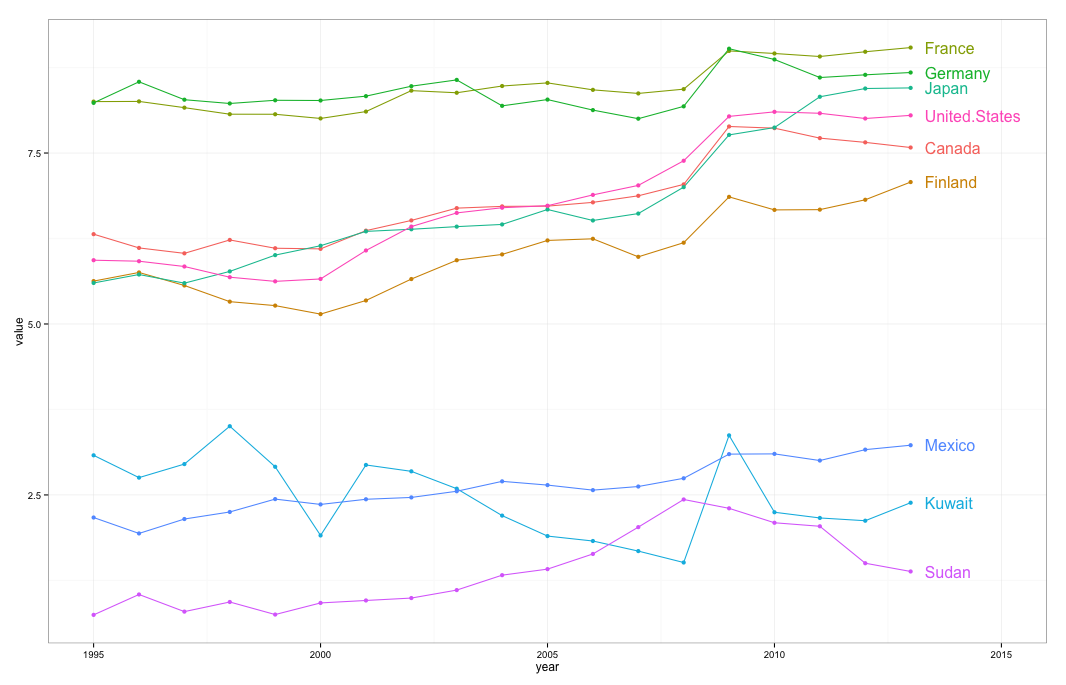
ggplot(smp, aes(x = year, y = value, group = country, colour = country)) +
  geom_line() + geom_point() +
  geom_dl(aes(label = country), list("last.points", dl.trans(x=x+0.5))) +
  xlim(1995, 2015) +
  theme_bw() + theme(legend.position = "none")
あと、ggplot2で作ったグラフでも論文誌に載せてくれると思います(少なくとも自分の分野では文句言われたことない)。
Enjoy!!
