こんにちは。
回転楕円体面上(WGS84)の地点と距離$s_{12}$とを与え、下記を求めてみました。
例では、$s_{12}$=1000km とし、地点はドラッグして動かせます。
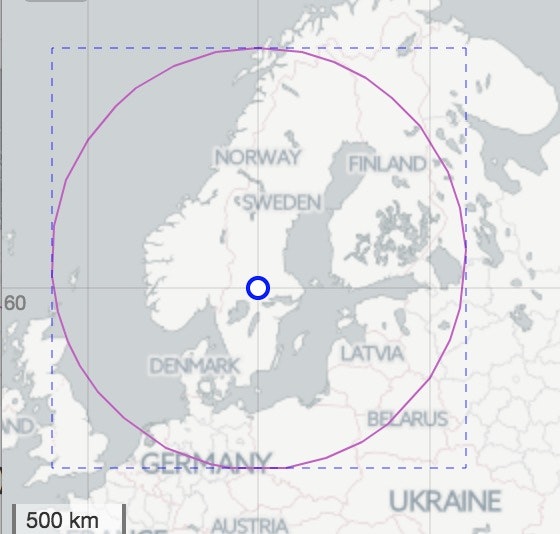
bounding rectangle の計算方法####
この bounding rectangle は下記の計算で求めます。
- その地点(緯度$\phi$)から、与えた距離$s_{12}$だけ南北へ移動した地点の緯度を計算3。
- その地点から経度$\lambda_{12}$離れた経線への距離$s_{12}$を求める問題・逆問題。ただしこれは今回解くのは止めて、$s_{12}$を与えて$\lambda_{12}$の上界を計算しました($\lambda_{12,\textrm{upper}}$:
function longitudinalBound())。
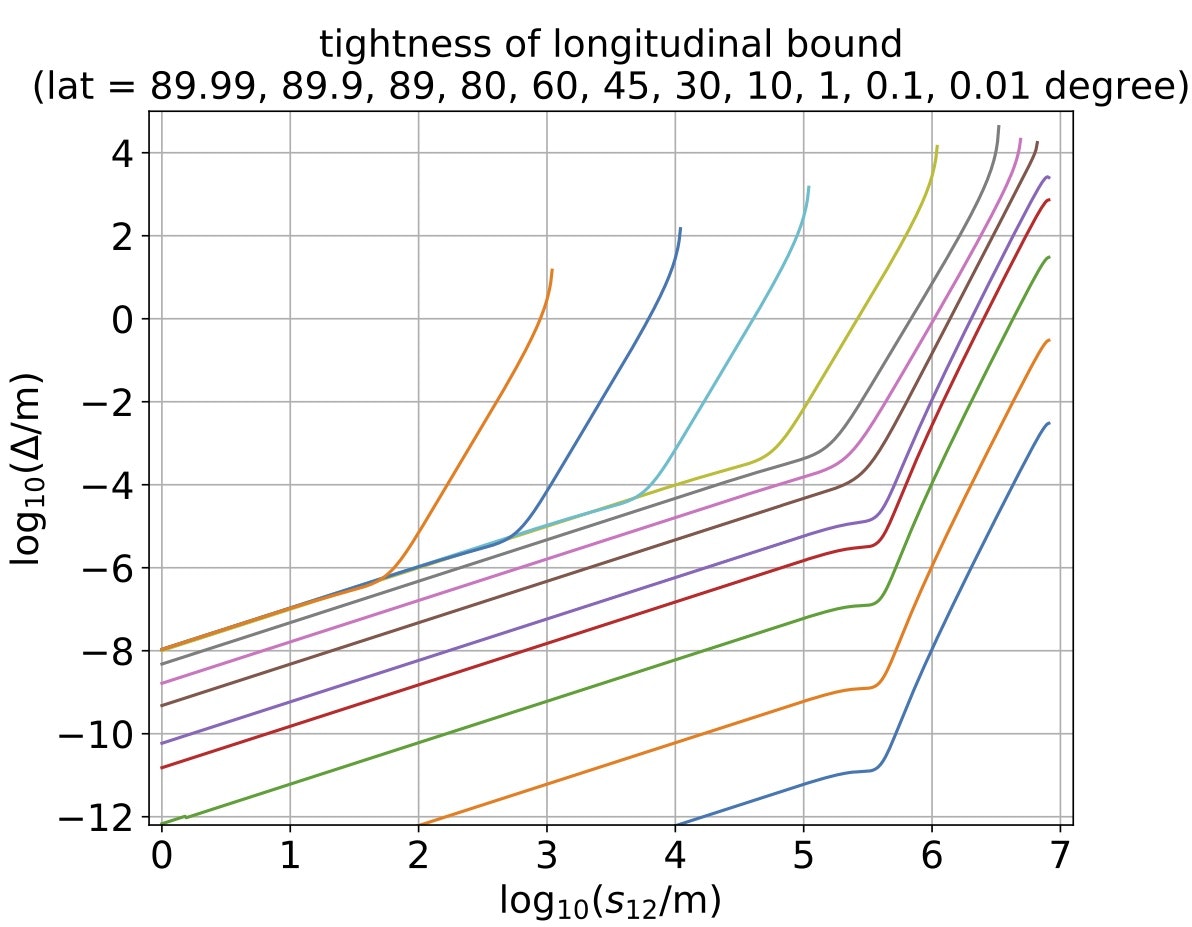
またこの上界 $\lambda_{12,\textrm{upper}}$ を誤差評価しました(ただし長さの次元に換算: tightness of longitudinal bound $\Delta$)。$s_{12}$に対して$\Delta$は、$s_{12}$が短いうちは線形で増加し、あるところからは ${s_{12}}^5$(5次)の増加になります。線形領域の係数は高緯度ほど大きく、例えば $\phi$ = 75 $^\circ$ かつ $s_{12}$=100 km では 10 ppb ($\Delta$ = 1 mm) に達します。
boundingRectangle.html
<!DOCTYPE html>
<html>
<head>
<title>bounding rectangle for an equidistant area in normal cylindrical projection (ellipsoidal earth)</title>
<meta charset="utf-8" />
<style type="text/css">html, body { height: 100%; margin: 0; padding: 0;} #map_canvas { height: 100%;}</style>
<link rel="stylesheet" href="https://unpkg.com/leaflet@1.0.3/dist/leaflet.css" />
<script src="https://unpkg.com/leaflet@1.0.3/dist/leaflet.js"></script>
<script src="L.SimpleGraticule.js"></script>
<script type="text/javascript" src="http://geographiclib.sourceforge.net/scripts/geographiclib.js"></script>
<script src="meridianArc.js"></script>
<style>
.div-icon {
width: 12px;
height:12px;
background: rgba(1,1,1,0);
position: absolute;
}
</style>
</head>
<body>
<div id='map_canvas'></div>
<script>
var par = {lon: 139.7607279, lat: 35.6858144, zoom: 2};
const KM = 1000.0;
const DEG = Math.PI/180;
const RE = 6378137.0; // IS-GPS
const FE = 1/298.257223563;
const E2 = FE*(2-FE)
var myGeoms = [];
var geod = GeographicLib.Geodesic.WGS84;
var cdbUrl = 'http://{s}.basemaps.cartocdn.com/light_all/{z}/{x}/{y}.png',
cdbAttr = '© <a href="http://openstreetmap.org">OpenStreetMap</a> contributors, ' +
'<a href="http://creativecommons.org/licenses/by-sa/2.0/">CC-BY-SA</a> | ' +
'© <a href="http://cartodb.com/attributions">CartoDB</a>';
var light = L.tileLayer(cdbUrl, {attribution: cdbAttr});
var map = L.map('map_canvas', {
center: [par['lat'], par['lon']],
zoom: par['zoom'],
layers: [light]
});
L.control.scale().addTo(map);
L.simpleGraticule({interval: 15, showOriginLabel: false}).addTo(map);
var svgIcon = L.divIcon({iconSize: null, className: 'div-icon', iconAnchor: [6, 7], html: '<svg width="12" height="12" xmlns="http://www.w3.org/2000/svg" xmlns:xlink="http://www.w3.org/1999/xlink"><circle cx="6" cy="6" r="5" stroke-width="2" stroke="blue" fill="white"/></svg>'});
var pointMarker = L.marker([par['lat'], par['lon']], {icon: svgIcon, draggable: true});
pointMarker.addTo(map);
update();
pointMarker.on('drag', function(e) {
update();
map.removeEventListener('mousemove');
});
function redraw(circles, rects) {
myGeoms.forEach(function(p, i){
map.removeLayer(p);
});
myGeoms = [];
circles.forEach(function(r, i){
var p = L.polyline(r, {
"color": "#c060c0",
"weight": 1.0
});
p.addTo(map);
myGeoms.push(p);
});
rects.forEach(function(r, i){
var p = L.polyline(r, {
"color": "#0000ff",
"weight": 0.4,
"dashArray": 4
});
p.addTo(map);
myGeoms.push(p);
});
}
function getLatLon(p) {
var pos = p.getLatLng();
pos.lon = pos.lng;
return pos;
}
function update() {
var mAng = 4, nDist = 1, dDist = 1000*KM;
var myPos = getLatLon(pointMarker);
var circles=[], rects=[];
for (var i=1; i<= nDist; i++) {
for (var ang = 0, poly = []; ang <= 360*mAng; ang++) {
poly.push(azimuthalPoint(myPos, ang/mAng, dDist*i))
}
circles.push(poly);
}
for (var i=1; i<= nDist; i++) {
rects.push(boundingRect(myPos, dDist*i));
}
redraw(circles, rects);
}
function azimuthalPoint(center, ang, dist) {
var vals = geod.Direct(center.lat, center.lon, ang, dist, GeographicLib.Geodesic.LONG_UNROLL);
return [vals.lat2, vals.lon2];
}
function boundingRect(center, dist) {
var rects =[], phi = Math.abs(center.lat)*DEG, rho = dist/RE;
if (phi + rho < 90*DEG) {
var dlon = longitudinalBound(phi, rho)/DEG;
var lons = [center.lon + dlon, center.lon - dlon];
var lats = meridianArc(center.lat, [dist, -dist]);
rects = [[lats[0], lons[0]], [lats[1], lons[0]], [lats[1], lons[1]], [lats[0], lons[1]], [lats[0], lons[0]]];
}
return rects;
}
function longitudinalBound(phi, rho) {
var sinPhi2 = Math.sin(phi)**2;
var dlon = Math.atan2(Math.sin(rho), Math.sqrt(Math.cos(rho)**2 - sinPhi2));
dlon -= E2*rho*sinPhi2*((4+E2*sinPhi2)/8/Math.cos(phi)-rho**5-E2*3);
return dlon;
}
</script>
</body>
</html>
meridianArc.js
// "Series approximations in tabular form" (GeographicLib)
// https://geographiclib.sourceforge.io/html/auxlat.html
// WGS84 (RE = 6378137, FE = 1/298.257223563)

const   N1 =    1.67922038638370469510315e-03,  // = FE / (2 - FE)
	    A1 =    1.00000070494540074870792,
	    C1 =  [-2.51882969175638440806573e-03,
	            2.64354292336349173194175e-06,
	           -3.45262585644834659361623e-09,
	            4.89182550044730242123802e-12,
	           -7.22871822456300161161581e-15,
	            1.09584677212207202645754e-17,
	           -1.68995229666217795571374e-20,
	            2.63826937093718673035741e-23],
	    C1P = [ 2.51882658439770326057482e-03,
	            3.70094903565753102921602e-06,
	            7.44777027013770151328465e-09,
	            1.70358571132471666509081e-11,
	            4.17811947310199261845752e-14,
	            1.07062997039824428098518e-16,
	            2.82735497163203869072946e-19,
	            7.63215202455139899487612e-22];

//  output: lat2 = lat1 + dlat(s12)
function meridianArc(lat1, s12) {
    var DEG = Math.PI/180;
    var mu1 = lat1*DEG + dot(C1, sineSequence(2*lat1*DEG, C1.length))/A1;
    var lat2 = s12.map(function(s12_, i){
        var mu2 = mu1 + s12_/RE*(1+N1)/A1;
        return (mu2 + dot(C1P, sineSequence(2*mu2, C1P.length)))/DEG;
    });
    return lat2;
}

function sineSequence(x, n) {
    var arr=[], cs=[1,0], c=Math.cos(x), s=Math.sin(x);
    for (var i=0; i<n; i++) {
        cs = [cs[0]*c-cs[1]*s, cs[1]*c+cs[0]*s];
        arr.push(cs[1])
    }
    return arr;
}

function dot(a, b) {
    for (var w=0, i=a.length-1; i>=0; i--) {
        w += a[i] * b[i];
    }
    return w;
}
-
等距離領域とは、もし地球が真球ならば円になります(Wikipedia: Circle of a sphere) ↩
-
計算は「回転楕円体面上の測地線」と同等で、GeographicLib を使用しました。 ↩
-
これは子午線弧長計算(第二種不完全楕円積分)とその逆計算の組合わせです。GeographicLib を使用しても同じことができます。 ↩