こんにちは。
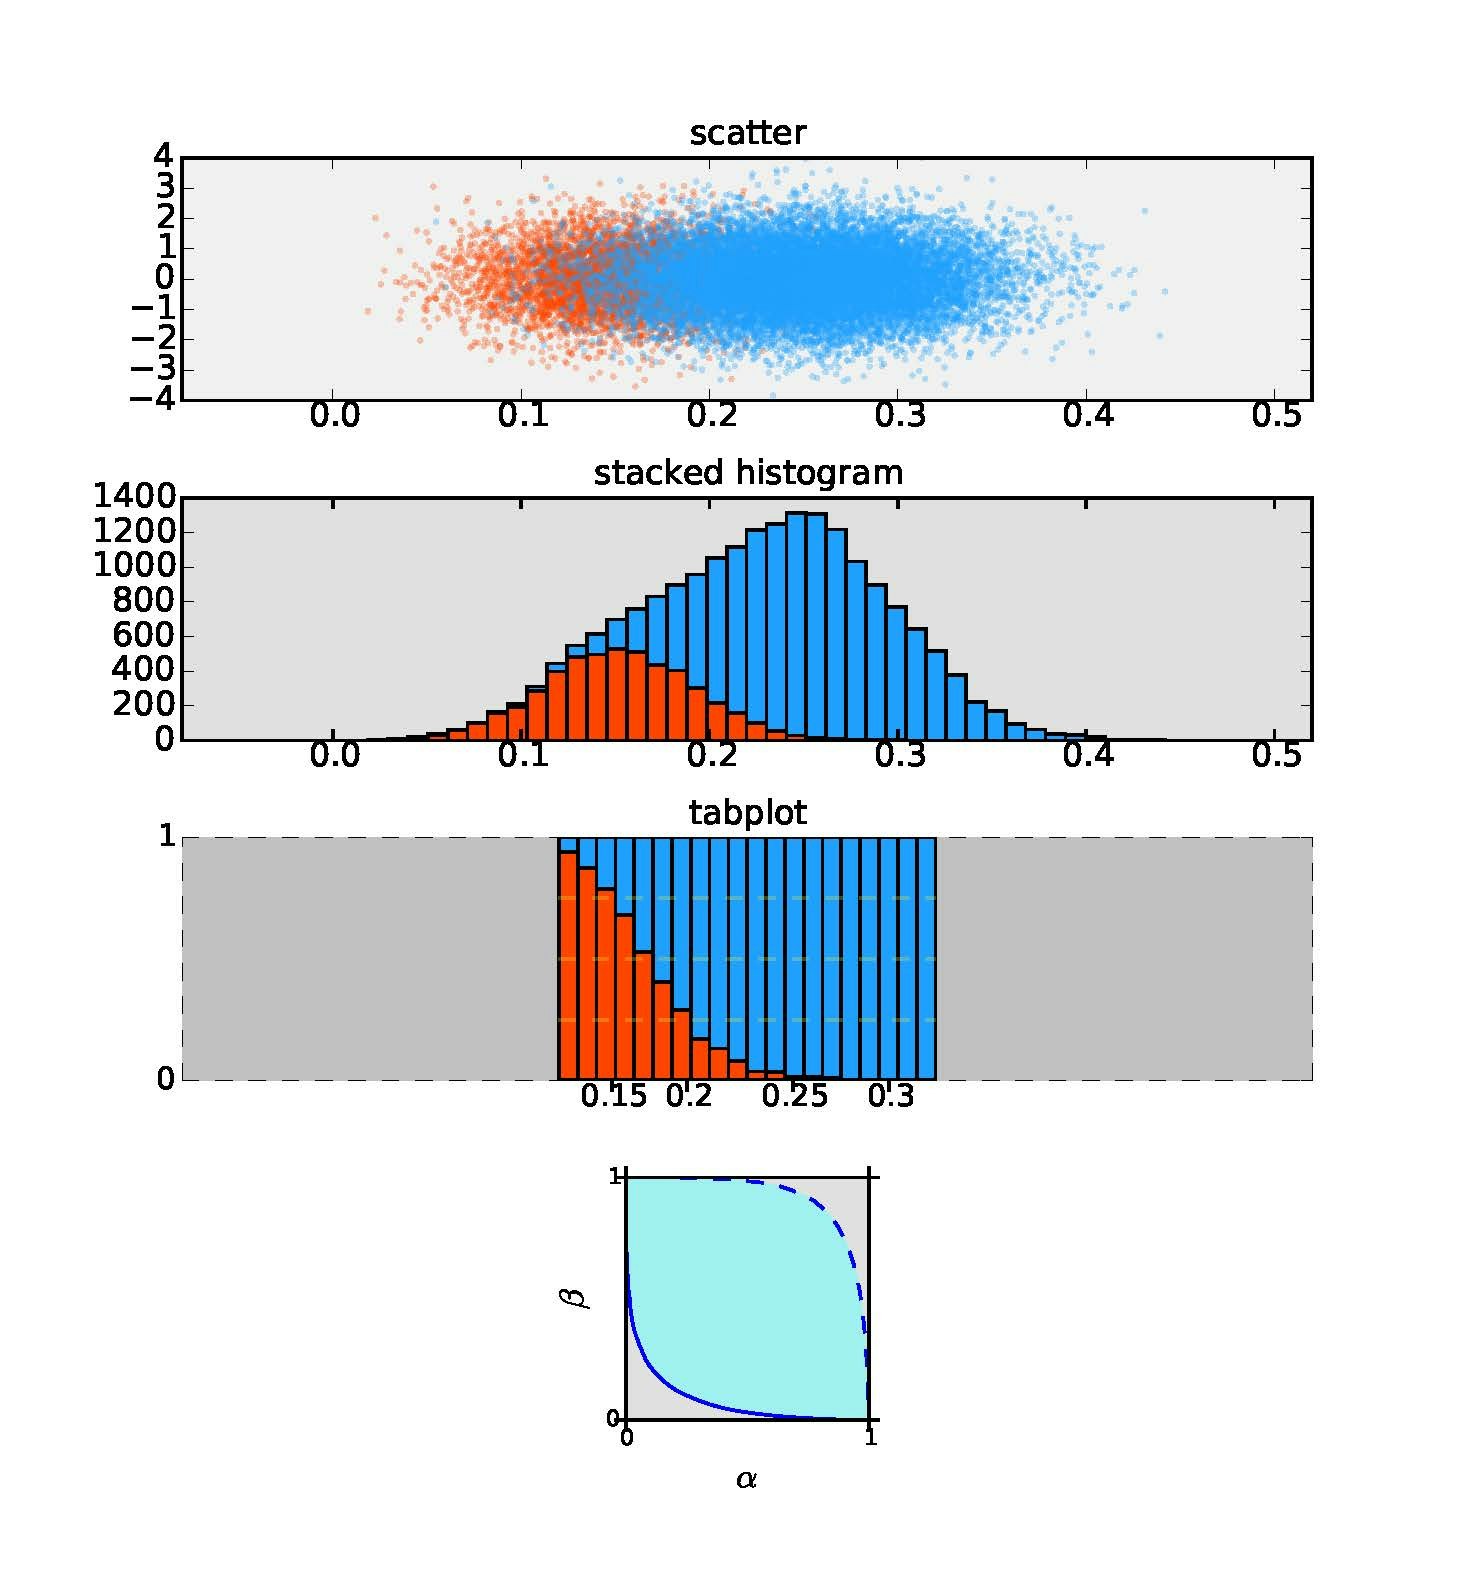
tabplot を見てなるほどと思いました(= a rectangular stacked histogram)。
そこで自分でもPythonを使って書いて見ました。また第一種過誤(α)対第二種過誤(β)のプロットでは検定の性能の挙動が見られます1。
import pylab

def tabbar(data):
    import random
    n = len(data)
    target = [list(map(lambda x: [x, i], y)) for i, y in enumerate(data)]
    target = sum(target, [])
    random.shuffle(target)
    target.sort(key=lambda x:x[0])
    histdata = [[] for i in range(n)]
    for i in range(len(target)):
        histdata[target[i][1]] += [float(i) / (len(target) - 1)]
    return histdata

data = [mu + sigma*pylab.randn(n) for mu, sigma, n in zip([0.15, 0.25], [0.04,0.05], [5000,15000])]
# pylab.hist(data, histtype='barstacked', rwidth=1)
pylab.hist(tabbar(data), histtype='barstacked', rwidth=1)
pylab.show()
-
なお検出力(1ーβ)をプロットするとROC曲線です。 ↩