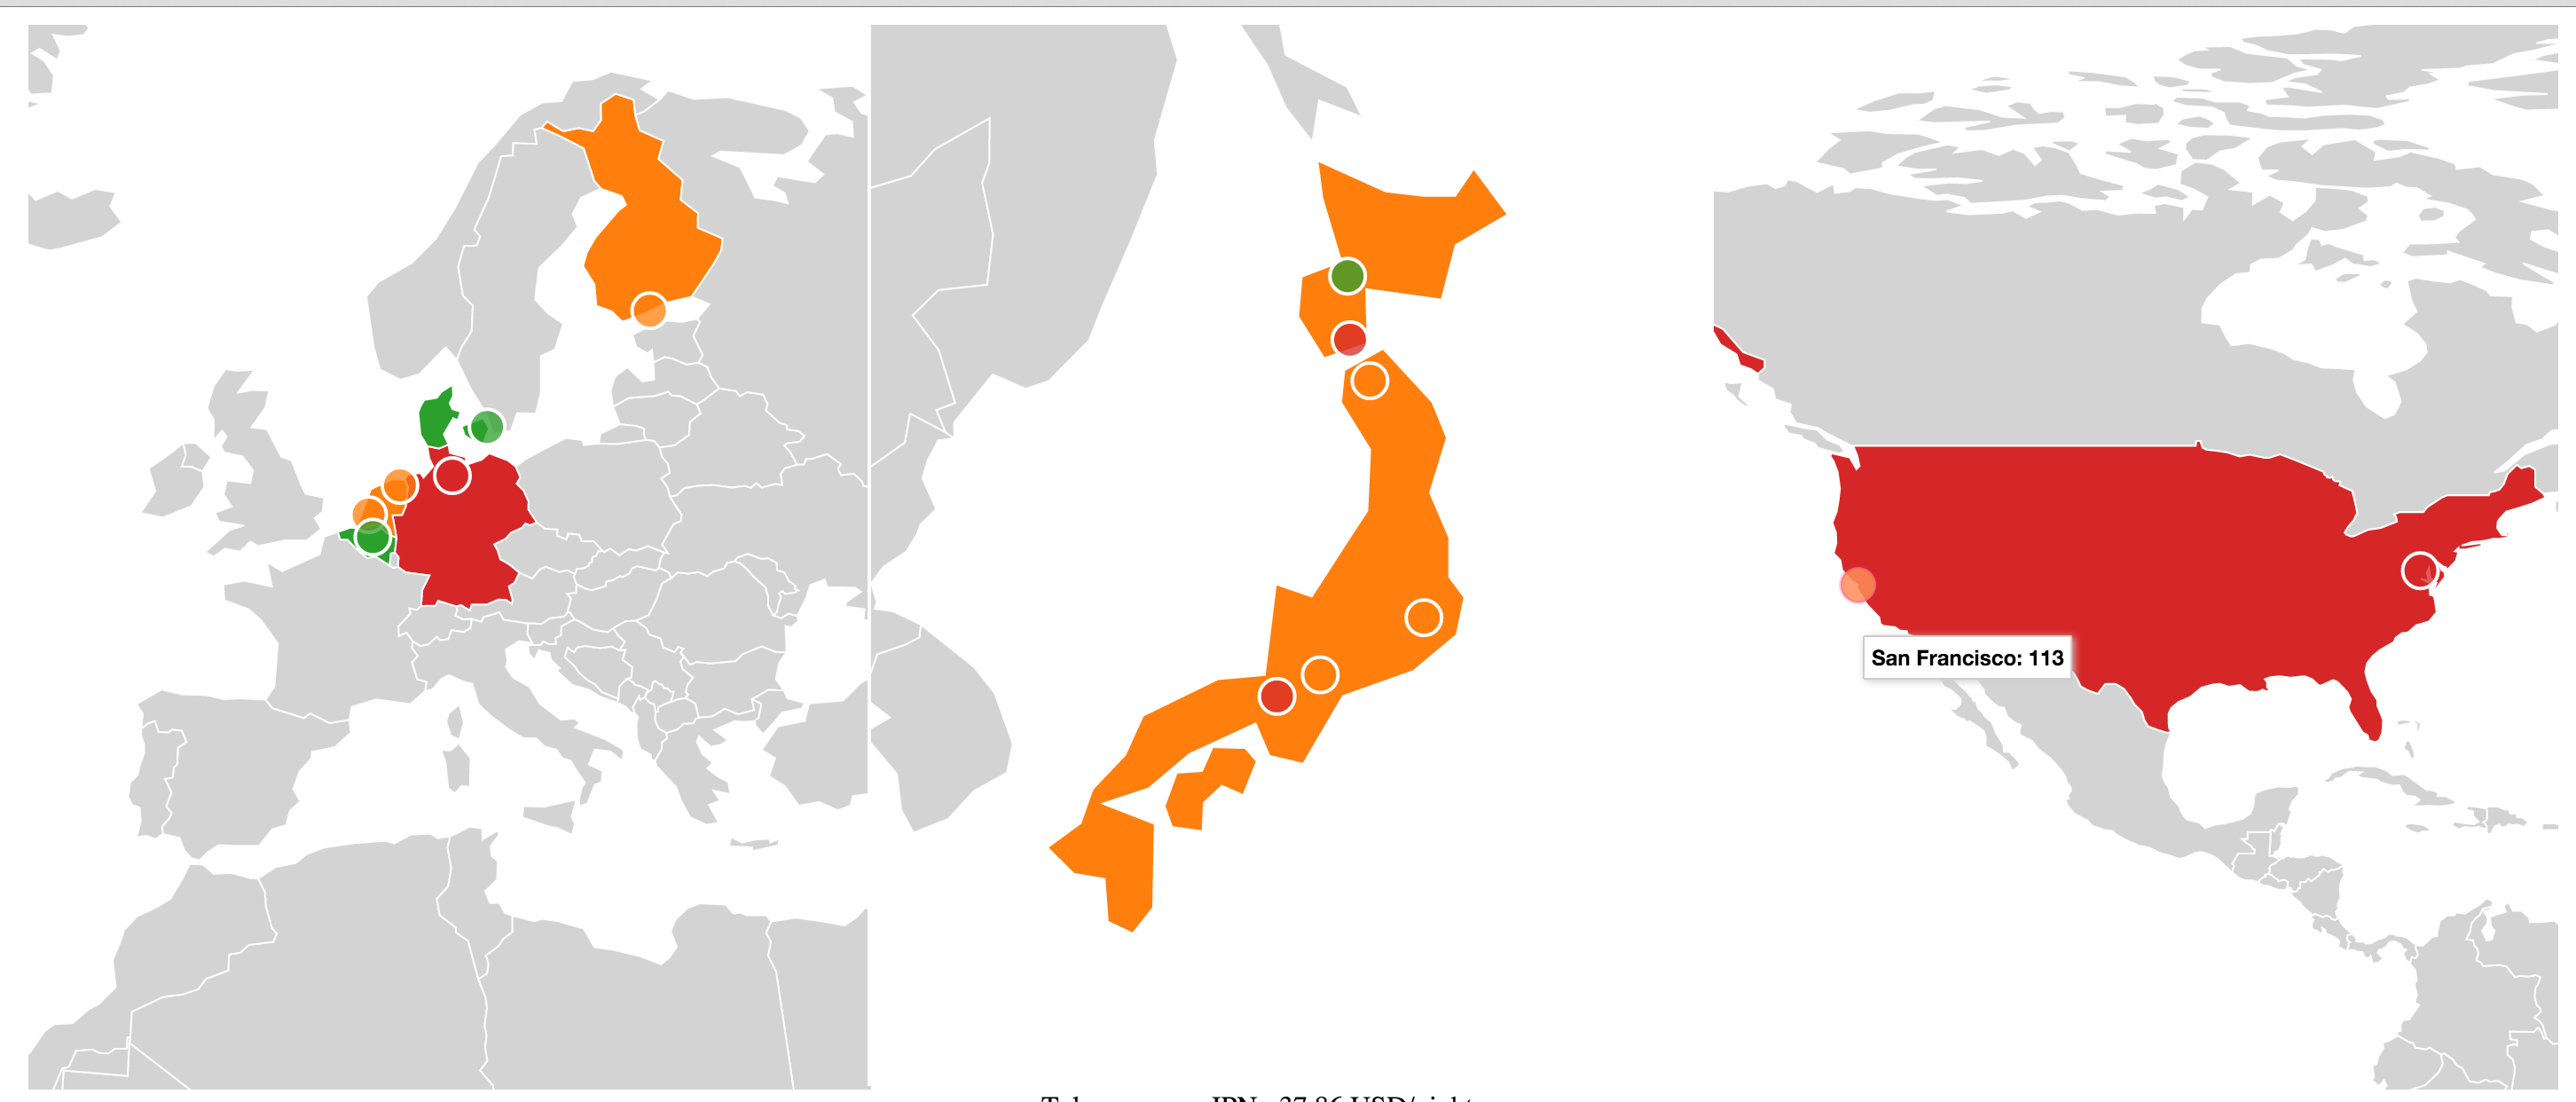
Recently, I made a little demo that shows my housing costs on an interactive map, like this:

(Yes, San Francisco is about 3-5x the price of everywhere else in the world)
This involves using a container node to mount D3 to using Datamaps. I then take some statistics and push it to my datamaps driver and it shows my data on the map.
Making this thing
To make this work, I use the standard Cycle.js DOM driver and provide my own two drivers: one for feeding in my data, and one for handling datamaps.
Drivers
Drivers are how you do side effects and load information from those back into your application. There are two steps involved: construction and usage. My table data driver is quite simple:
export default function makeTableDataDriver() {
  // create my data
  let data = [
    ['Tokyo', 'JPN', 37.86],
    ['Nagoya', 'JPN', 47.71],
    ['Kyoto', 'JPN', 59.29],
  ];

  // transform it into the format I'm going to use
  let locations = data.map((v, i) => ({
    id: i,
    name: v[0],
    country: v[1],
    price: v[2]
  }));

  // return my driver, which can be called to get the data stream.
  // the reason for why I map my data with a function will be explained later.
  return function tableDataDriver() {
    return Rx.Observable.just(locations)
      .map(locations => state => Object.assign({}, {locations}));
  };
}
Making the Datamap driver is more involed. First, I have three regions I want to show, so I should be able to configure my driver for a given region. Second, I need a container to render in, but I will not have this container available until my application has rendered. Third, I need data to push into my maps.
While I can expose makeDataDriver : Region where type Region = String, I'm going to have to come up with a way to get my container into the input stream of this driver. Let's look at the rest of the application first.
The Application
Just like any Cycle.js application, I initialize my drivers with whatever configuration is needed and then have a main function I have run by the frameworky bits. My main function will connect my streams and transform them as needed and provide streams for the drivers themselves to consume. Nice enough, right?
Like I said above, I'll initialize my Datamap drivers with the region that I actually want.
let drivers = {
  DOM: makeDOMDriver('#app'),
  TableData: makeTableDataDriver(),
  DataMapEU: makeDatamapDriver('europe'),
  DataMapAS: makeDatamapDriver('asia'),
  DataMapUS: makeDatamapDriver('us')
};
And my main function contains this near the end:
let containerEU$ = getDOMElement$(drivers.DOM, '.datamap-europe');
let containerAS$ = getDOMElement$(drivers.DOM, '.datamap-asia');
let containerUS$ = getDOMElement$(drivers.DOM, '.datamap-us');

return {
  DOM: view$,
  DataMapEU: prepareDataMap$(containerEU$, statistics$),
  DataMapAS: prepareDataMap$(containerAS$, statistics$),
  DataMapUS: prepareDataMap$(containerUS$, statistics$)
};
where getDOMElement$ is defined
function getDOMElement$(DOMDriver, selector) {
  const DOMObservable = DOMDriver.select(selector).observable;
  return DOMObservable.map(results => results[0]);
}
Such that the DOMObservable will give me an array of document query matches, and the output stream will either output an element or [][0] === undefined.
Using this element stream, I combine this container with my statistics with a simple prepareDataMap$ function defined
function prepareDataMap$(container$, statistics$) {
  return Rx.Observable.combineLatest(
    container$, statistics$,
    (container, statistics) => ({
      container, statistics
    })
  );
}
And then my view function actually renders these containers for me:
function view(state) {
  return h('div', [
    h('div', {id: 'datamap', className: 'sections'}, [
      h('div', {className: 'datamap-europe'}),
      h('div', {className: 'datamap-asia'}),
      h('div', {className: 'datamap-us'})
    ]),
    h('div', {style: {width: '300px', margin: 'auto'}}, [
      locationsList(state.locations)
    ])
  ]);
}
Writing this Datamap driver
There's a lot of crap involved in setting up Datamaps, but I'll just paraphrase. I prepare a projection based on the region I want to look at and that is what gets used when I mount Datamaps to my container. I draw a Choropleth for country prices, and bubbles for city prices.
Here's the gist of what I do:
export default function makeDatamapDriver(region) {
  return function datamapDriver(input$) {
    let datamap;

    input$.subscribe(({container, statistics}) => {
      if (!container) {
        // if we have no container, then do cleanup on what we had before to prevent leakage
        datamap = null;
        return;
      } else if (!datamap) {
        // if we have a container but no datamap instance, create one
        datamap = new Datamap({
          element: container,
          setProjection: getProjection(region),
          [...]
        });
      }

      if (!datamap) {
        // if we don't have a datamap instance, then quit out
        return;
      }

      // draw our choropleth
      // draw our bubbles
    });
  };
}
And that's about it! This is how I handle mounting on to a container and updating my datamaps. It might not be super pretty, but I can reasonably do 'afterRender' and 'afterTeardown' operations this way.
I have an alternativeView function that you can try that will even toggle the container nodes on and off, making the Datamaps driver mount new datamaps instances accordingly.
function alternativeView(state) {
  return Rx.Observable.interval(1000).map(function (time) {
    if (time % 2 === 0) {
      return h('div');
    } else {
      return h('div', [
        h('div', {id: 'datamap', className: 'sections'}, [
          h('div', {className: 'datamap-europe'}),
          h('div', {className: 'datamap-asia'}),
          h('div', {className: 'datamap-us'})
        ]),
        h('div', {style: {width: '300px', margin: 'auto'}}, [
          locationsList(state.locations)
        ])
      ]);
    }
  });
}
Demo & Repo
I have a demo up here: http://justinwoo.github.io/housing-costs-maps
Repo is here: https://github.com/justinwoo/housing-costs-maps
Conclusion
So I hope you found this a little bit useful on how you can write drivers to have side effects in your application (even DOM side effects separate from the DOM driver).
If you made it this far, thanks! Let me know if you found this at all useful or have a bettter solution on Twitter: (@jusrin00).
References
- Cycle.js drivers: http://cycle.js.org/drivers.html
- Datamaps: https://github.com/markmarkoh/datamaps