状態空間モデルのバリエーションの1つである時変係数回帰モデルを試してみる記事です。Rのdlmを使うのが楽なので、今回はrpy2を通じてPythonからRのdlmを呼び出して実行してみます。
Rによるdlmの時変係数モデルの使い方については、Logics of Blue「dlmによる時変係数モデル」を大いに参考にさせていただきました。本記事は、こちらのモデルから説明変数を1つから2つに変更して、Pythonからrpy2を通じて使ってみた、というものです。
1. 時変係数回帰モデルとは
名前の通り、時間によって回帰の係数が時間によって変わっていくモデルのことです。
y_t = a_t x_t + b_t + v_t \quad \cdots (1)
$y_t$: 時点$t$の被説明変数
$x_t$: 時点$t$の説明変数
$a_t$: 時点$t$の回帰係数
$b_t$: 時点$t$の切片
$v_t$: 時点$t$の観測誤差
のように、回帰係数が時間により変化していきます。その際、
a_t = a_{t-1} + e_t \quad \cdots (2)
のように前期の回帰係数に$e_t$の誤差がのり、時期$t$の回帰係数となる、という仕組みです。
状態空間モデルの言葉で言うと、(1)が観測モデルで、(2)がシステムモデルです。
今回は説明変数が2つあるケースを試してみたいので、一連の方程式は下記の通りとなります。
\begin{aligned}
y_t &= a^{(1)}_t x^{(1)}_t + a^{(2)}_t x^{(2)}_t +b_t + v_t \\
a^{(1)}_t &= a^{(1)}_{t-1} + e^{(1)}_t \\
a^{(2)}_t &= a^{(2)}_{t-1} + e^{(2)}_t \\
b_t &= b_{t-1} + w_t \\
\\
v_t &\sim N(0, \sigma_{v})\\
e^{(1)}_t &\sim N(0, \sigma_{e}^{(1)}) \\
e^{(2)}_t &\sim N(0, \sigma_{e}^{(2)}) \\
w_t &\sim N(0, \sigma_{w})\\
\end{aligned}
観測モデルが1本、システムモデルが3本あります。潜在変数は$a^{(1)}_t, a^{(2)}_t, b_t$の3つ×時間数$t$の$3t$個あります。
2. データを作る
先ほどの方程式に準じて各種パラメーターを設定したのちに乱数生成してデータを作ります。この人工データのパラメータ仕様は[1]を参考にさせていただきました。
rd.seed(71)

T = 500
v_sd = 20 # 観測誤差の標準偏差
i_sd = 10 # interceptの標準偏差
a10 = 10
e_sd1 = .5 # 回帰係数1の変動の標準偏差
a20 = 20
e_sd2 = .8 # 回帰係数1の変動の標準偏差

# 時変回帰係数2つ
e1 = np.random.normal(0, e_sd1, size=T)
a1 = e1.cumsum() + a10
e2 = np.random.normal(0, e_sd2, size=T)
a2 = e2.cumsum() + a20

# intercept
intercept = np.cumsum(np.random.normal(0, i_sd, size=T))

# 説明変数
x1 = rd.normal(10, 10, size=T)
x2 = rd.normal(10, 10, size=T)

# 被説明変数
v = np.random.normal(0, v_sd, size=T) # 観測誤差
y = intercept + a1*x1 + a2*x2 + v
y_noerror = intercept + a1*x1 + a2*x2  # 観測誤差がなかった時の y
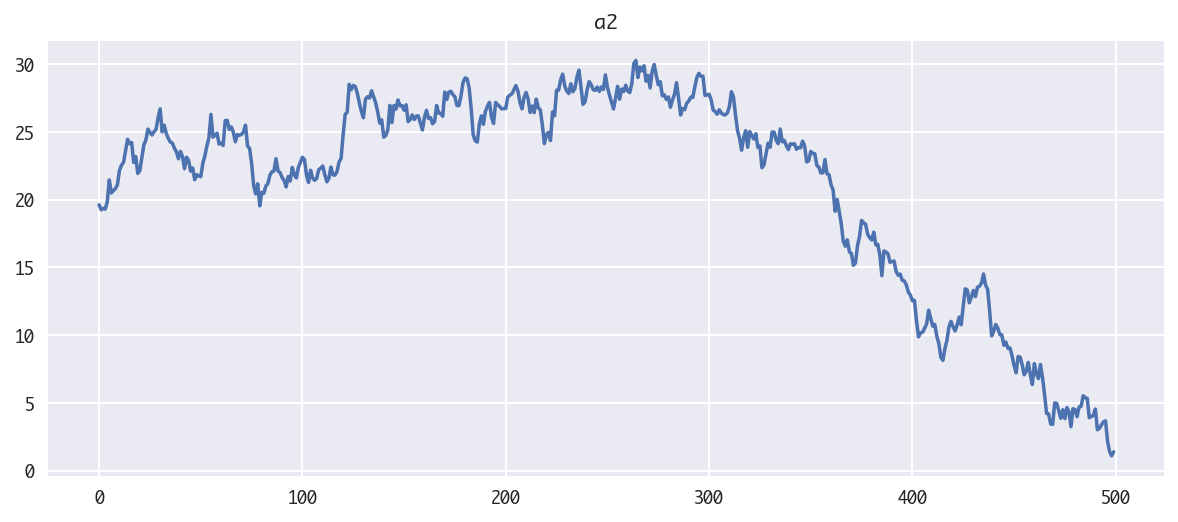
できたグラフが以下です。まずは、推定したい3種の潜在変数のプロットです。
- 回帰係数その1のグラフ

- 回帰係数その2のグラフ

- 切片のグラフ

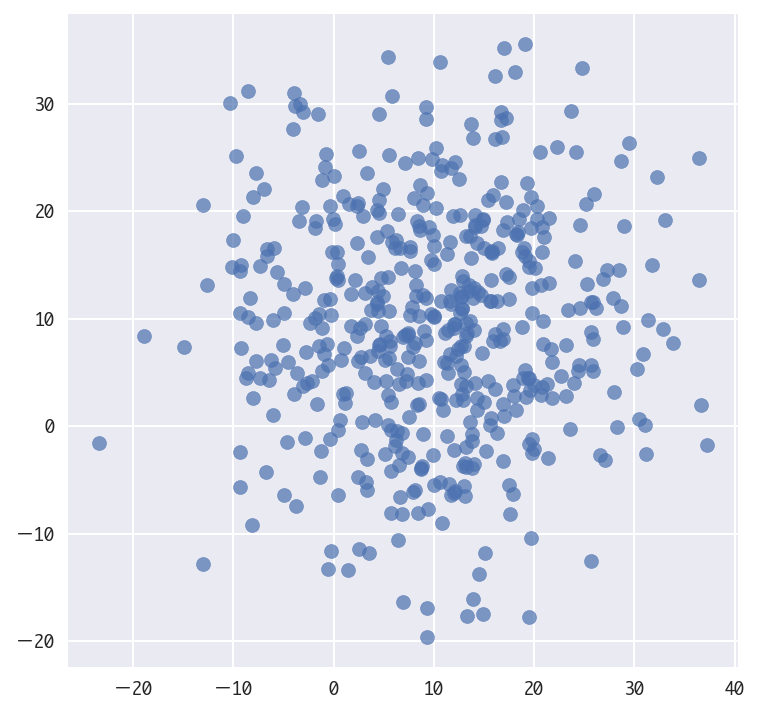
説明変数は2つの独立な正規分布に従うデータです。
- 説明変数 $x^{(1)}_t, x^{(2)}_t$

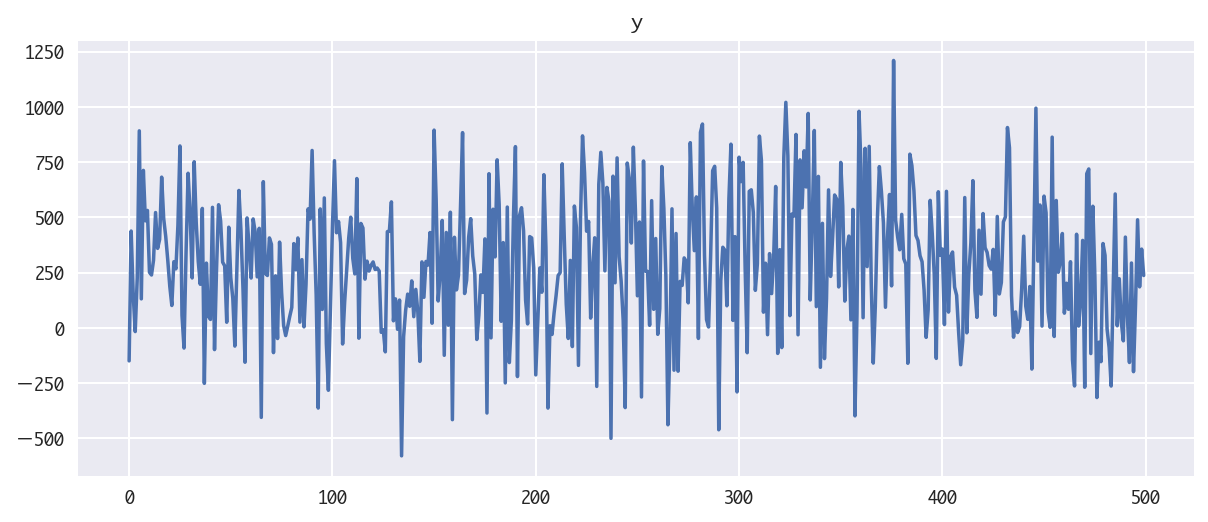
結果$y$のグラフは、あまり人の目で見てもただの乱数で何か構造があるようにあまり見えませんね。このデータから本当に潜在変数がうまく推定できるのでしょうか、確認してみたいと思います。
3. dlmを用いたモデルの推定
さてここからが本番です。rpy2を通じてPythonからRのdlmを呼び出して時変係数回帰モデルを推定してみたいと思います。
3-1. rpy2インポート
rpy2をインポートします。
import rpy2
from rpy2.robjects.packages import importr
import rpy2.robjects as robjects
from rpy2.rinterface import R_VERSION_BUILD
from rpy2.robjects import pandas2ri
pandas2ri.activate()
Rのライブラリ、dlmをインポートします。
dlm = importr("dlm")
3-2. 状態空間モデルのモデル指定
ここで、状態空間モデルの型を指定します。今回、説明変数がある回帰モデルなのでdlmModRegを使います。
Xは説明変数で、今回x1,x2の2つがあるのでそのデータをセットします。
dVは観測モデルの誤差の分散で、$v_t$の分散$\sigma_v$を表します。
dWはシステムモデルの誤差の分散です。今回システムモデルが $e^{(1)}_t, e^{(2)}_t, w_t$ に関するものとして3つありますので、
それぞれ $\sigma_{e}^{(1)}, \sigma_{e}^{(2)}, \sigma_w$に対応しています。
buildDlmReg = lambda theta: dlm.dlmModReg(
    X=df[["x1", "x2"]],
    dV=np.exp(theta[0]),
    dW=[np.exp(theta[1]), np.exp(theta[2]), np.exp(theta[3])]
  )
モデルの型が決まったので、観測値yをセットして最尤法でパラメーターを求めます。初期値によって推定がおかしくなることがあるのでdlmMLEを2度使って推定しています。初回のdlmMLEの結果を初期値として2回目のdlmMLEを実行し安定性を高めるということですね。
3-3. 最尤法による誤差の分散の推定
# 2段階で最尤推定を行う
%time parm = dlm.dlmMLE(y, parm=[2, 1, 1, 1], build=buildDlmReg, method="L-BFGS-B")
par = np.array(get_method(parm, "par"))
print("par:", par)
%time fitDlmReg = dlm.dlmMLE(y, parm=par, build=buildDlmReg, method="SANN")
結果を表示してみます。
show_result(fitDlmReg)
下記のparが$\sigma_v, e^{(1)}_t, e^{(2)}_t, w_t$の4つの標準偏差の推定結果に対応しますが、dlmModRegにセットした時にnp.expを間にかませて値が負にならないようにしていたので、結果のnp.expを取ってさらにnp.sqrtを取ってあげると標準偏差になります。
par [1]  5.9998846  4.5724213 -1.6572242 -0.9232988

value [1] 2017.984

counts function gradient
   10000       NA

convergence [1] 0

message NULL
実際に計算してみると、人工データを作る時に指定したパラメーターがほぼ再現できていることがわかります。
par = np.asanyarray(get_method(fitDlmReg, "par"))
modDlmReg = buildDlmReg(par)
estimated_sd = np.sqrt(np.exp(np.array(get_method(fitDlmReg, "par"))))
pd.DataFrame({"estimated_sd":estimated_sd, "sd":[v_sd, i_sd, e_sd1, e_sd2]})
| estimated_sd | sd | |
|---|---|---|
| 0 | 20.084378 | 20.0 |
| 1 | 9.837589 | 10.0 |
| 2 | 0.436655 | 0.5 |
| 3 | 0.630243 | 0.8 |
3-4. フィルタリングとスムージングの実行
さて、この結果を使って、カルマンフィルタでフィルタリングを行った値を求め、さらにそのフィルタ値からスムージングした値を求めます。
# カルマンフィルタ
filterDlmReg = dlm.dlmFilter(y, modDlmReg)

# スムージング
smoothDlmReg = dlm.dlmSmooth(filterDlmReg)
求めたフィルタリングとスムージングの結果をPythonの世界に戻してあげてndarrayとして保持します。
# フィルタリングした値を取得
filtered_a = np.array(get_method(filterDlmReg, "a"))

# 平滑化した値を取得
smoothed_a = np.array(get_method(smoothDlmReg, "s"))
3-5. 推定結果の可視化
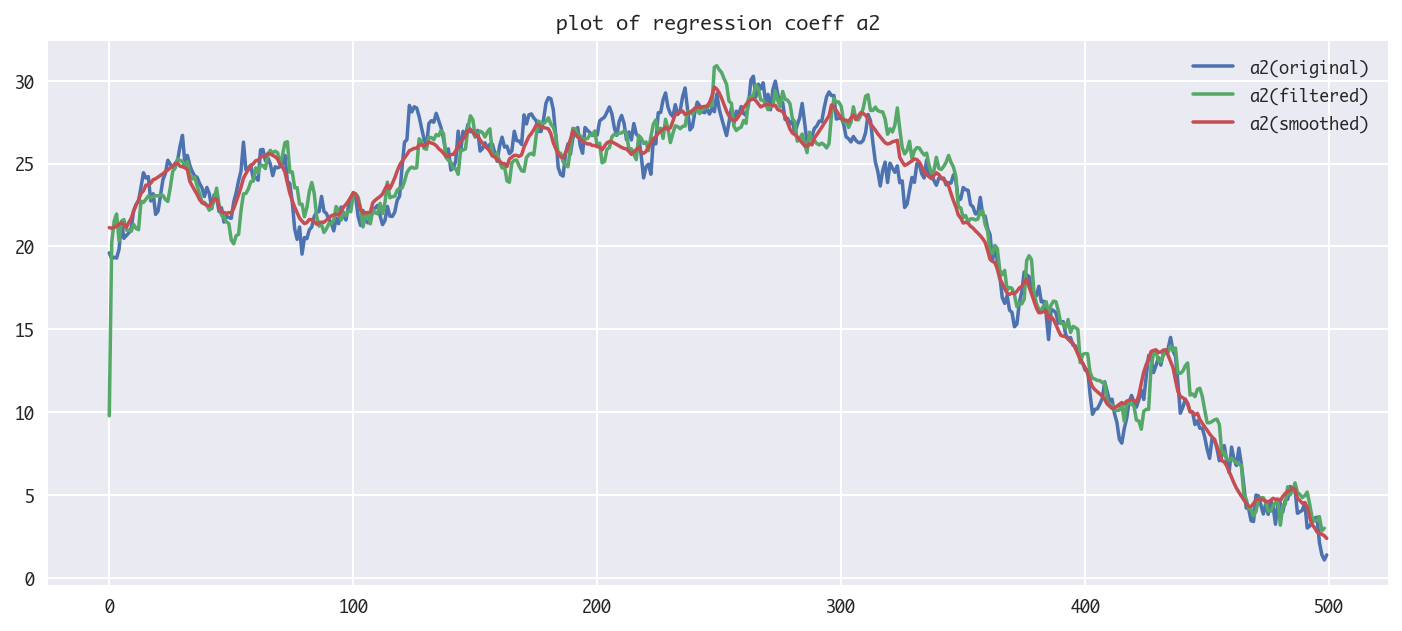
下記に、切片intercept、回帰係数 $a^{(1)}_t, a^{(2)}_t$の2つ結果のグラフを示します。それぞれ人工データの元の値を青、フィルタリングした値を緑、スムージングした値を赤で示していますが、かなり元のデータの動きを再現できているかと思います。当然ですがdlmにはx1, x2, yの3つのデータと、状態空間モデルの型しか与えていないのですが、きちんと切片、回帰係数を復元できています!(初期値付近だけは値が暴れていますね)
plt.figure(figsize=(12,5))
plt.plot(df.intercept, label="intercept(original)")
plt.plot(filtered_a[1:,0], label="intercept(filtered)")
plt.plot(smoothed_a[1:,0], label="intercept(smoothed)")
plt.legend(loc="best")
plt.title("plot of intercept")

plt.figure(figsize=(12,5))
plt.plot(df.a1, label="a1(original)")
plt.plot(filtered_a[1:,1], label="a1(filtered)")
plt.plot(smoothed_a[1:,1], label="a1(smoothed)")
plt.legend(loc="best")
plt.title("plot of regression coeff a1")

plt.figure(figsize=(12,5))
plt.plot(df.a2, label="a2(original)")
plt.plot(filtered_a[1:,2], label="a2(filtered)")
plt.plot(smoothed_a[1:,2], label="a2(smoothed)")
plt.legend(loc="best")
plt.title("plot of regression coeff a2")

最後に、yの値の観測誤差を抜いたものと、スムージングした潜在変数を用いてyを算出したものを比較してみます。こちらも観測誤差を取り除いて、真のyの値をかなり再現できていることがわかります!
estimatedLevel = smoothed_a[1:,0] + df.x1*smoothed_a[1:,1] + df.x2*smoothed_a[1:,2]
plt.figure(figsize=(12,5))
plt.plot(y_noerror, lw=4, label="y(original)")
plt.plot(estimatedLevel, "r", lw=1, label="y(estimated) [no observation error]")
plt.legend(loc="best")
plt.title("plot of target value.")

参考
[1] Logics of blue "dlmによる時変係数モデル"
http://logics-of-blue.com/dlm%E3%81%AB%E3%82%88%E3%82%8B%E6%99%82%E5%A4%89%E4%BF%82%E6%95%B0%E3%83%A2%E3%83%87%E3%83%AB/
[2]今回のコードをアップしたもの(github)
https://github.com/matsuken92/Qiita_Contents/blob/master/General/dlm_time_varying_regression.ipynb
[2]今回のコードをn変数で対応できるようにしたバージョン(github)
https://github.com/matsuken92/Qiita_Contents/blob/master/General/dlm_time_varying_regression_n-var.ipynb
