Sparkシリーズ第2弾です。今度はMLlibを使って協調フィルタリングを用いたレコメンデーションの実装を行います。
第一弾
【機械学習】iPython NotebookでSparkを起動させてMLlibを試す
http://qiita.com/kenmatsu4/items/00ad151e857d546a97c3
環境
- OS: Mac OSX Yosemite 10.10.3
- Spark: spark-1.5.0-bin-hadoop2.6
- Python: 2.7.10 |Anaconda 2.2.0 (x86_64)| (default, May 28 2015, 17:04:42)
本稿では上記の環境で行ったものを記載していますので、他の環境では設定が異なる場合もあるかと思いますのでご注意ください。また、基本的にiPython NotebookでのSparkの実行を想定しています。このやり方については、前記事をご参照ください。
1. Sparkの起動
まずはSparkを起動します。
# Sparkの起動
import os, sys
import pandas as pd
import numpy as np
from datetime import datetime as dt
print "loading PySpark setting..."
spark_home = os.environ.get('SPARK_HOME', None)
print spark_home
if not spark_home:
    raise ValueError('SPARK_HOME environment variable is not set')
sys.path.insert(0, os.path.join(spark_home, 'python'))
sys.path.insert(0, os.path.join(spark_home, 'python/lib/py4j-0.8.2.1-src.zip'))
execfile(os.path.join(spark_home, 'python/pyspark/shell.py'))
2.データの準備
Sparkに同梱されているサンプルデータで、MovieLensという映画のレビュー情報のデータがありますのでそれを使います。下記のように、SPARK_HOMEにあるデータを読み込みます。
# Exampleデータの読み込み
df = pd.read_csv(os.path.join(spark_home, 'data/mllib/als/sample_movielens_ratings.txt'),
                 delimiter='::', names=('uid', 'iid', 'rating','time'),engine='python')
pv_rating = df.pivot(index='uid', columns='iid', values='rating').fillna(0)

print pv_rating
こんな感じのデータです。
uidはユーザーID, iidはアイテム(映画)ID、中のデータはユーザーごとの映画のratingです。
| uid\iid | 0 | 1 | 2 | 3 | 4 | ... | 95 | 96 | 97 | 98 | 99 |
|---|---|---|---|---|---|---|---|---|---|---|---|
| 0 | 0 | 0 | 3 | 1 | 0 | ... | 2 | 1 | 0 | 1 | 1 |
| 1 | 0 | 0 | 2 | 1 | 2 | ... | 0 | 1 | 1 | 0 | 0 |
| 2 | 0 | 0 | 0 | 0 | 3 | ... | 0 | 0 | 0 | 0 | 0 |
| 3 | 1 | 1 | 1 | 0 | 0 | ... | 0 | 0 | 0 | 0 | 0 |
| ... | |||||||||||
| 27 | 1 | 0 | 0 | 0 | 0 | ... | 1 | 0 | 0 | 1 | 0 |
| 28 | 3 | 1 | 4 | 1 | 0 | ... | 2 | 0 | 0 | 1 | 1 |
| 29 | 0 | 0 | 0 | 1 | 1 | ... | 0 | 0 | 1 | 0 | 1 |
3. データの可視化
まずはどんなデータであるか、可視化してみます。
# Ratingの可視化
%matplotlib inline
import matplotlib.pyplot as plt
import matplotlib.cm as cm

n_y, n_x = pv_rating.shape
X, Y = np.meshgrid(range(n_x+1), range(n_y+1))
Z = pv_rating.as_matrix()
Z.astype(np.float32)
Z = Z[::-1,:]
print Z.shape
fig = plt.figure(figsize=(19,5))
ax = plt.subplot(111)
plt.ylim(0,30)
plt.xlim(0,99)
ax.set_xticks([])
ax.set_yticks([])
cax = ax.pcolor(X, Y, Z, cmap=cm.get_cmap('ocean_r'), alpha=0.6)

cbar = fig.colorbar(cax, ticks=range(6))
# cbar.ax.set_yticklabels(['5', '4', '3', '2', '1', '0'])# vertically oriented colorbar
plt.show()
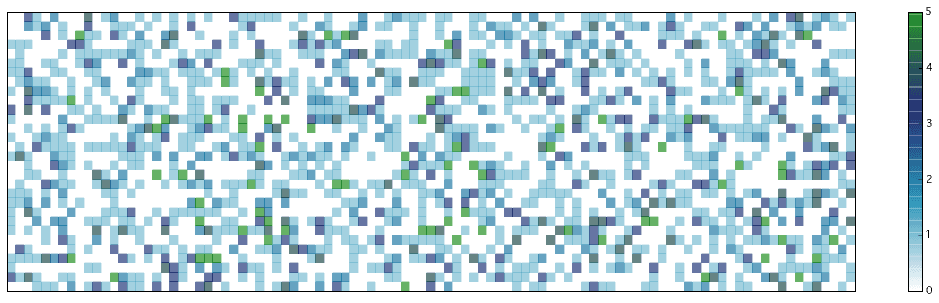
縦軸がユーザー、横軸が映画になっています。
白いところはrating(映画の評価)がないところ。色があるところはrating情報があり、右のバーで表されているように数値が色分けされています。
4.レコメンデーションの実行
ここからが本題。Sparkに付属のMLlibにあるALS(Alternating Least Squares)という手法でレコメンデーションを行います。これは協調フィルタリングという手法で、あるユーザと嗜好(ここでは映画のrating)の類似した他のユーザの情報を用いて推論を行う方法です。映画のコンテンツはある意味無視して、ユーザーの行動から推論するところが特徴の一つです。
さっそく、データから学習を実施します。
from pyspark.mllib.recommendation import ALS, MatrixFactorizationModel, Rating

# トレーニングデータの準備
sc_rating = sc.parallelize(df.as_matrix())
ratings = sc_rating.map(lambda l: Rating(int(l[0]), int(l[1]), float(l[2])))

# ALS(Alternating Least Squares)でレコメンデーションの生成
rank = 10
numIterations = 10
model = ALS.train(ratings, rank, numIterations)

# 学習したデータからデータがなかった部分にratingを付与する
n_y, n_x = pv_rating.shape
X, Y = np.meshgrid(range(n_x+1), range(n_y+1))
f_XY = np.c_[Y.flatten(), X.flatten()]
predictions_all = model.predictAll(sc.parallelize(f_XY)).map(lambda r: ((r[0], r[1]), limitter(r[2]) ))

def selector(x, y):
    if x is None:
        return y
    elif x != 0:
        return x
    else:
        return y

# すでにratingがあるところはキープして、無いところにALSで計算した値を代入
ratesAndPreds = ratings.map(lambda r: ((r[0], r[1]), r[2])).rightOuterJoin(predictions_all).map(lambda r: ((r[0][0], r[0][1]), selector(r[1][0], r[1][1])) )

result = np.array(ratesAndPreds.sortBy(lambda x: (x[0], x[1])).collect())
Z = result[:,1]
Z = Z.astype(np.float32).reshape(pv_rating.shape)[::-1,:]
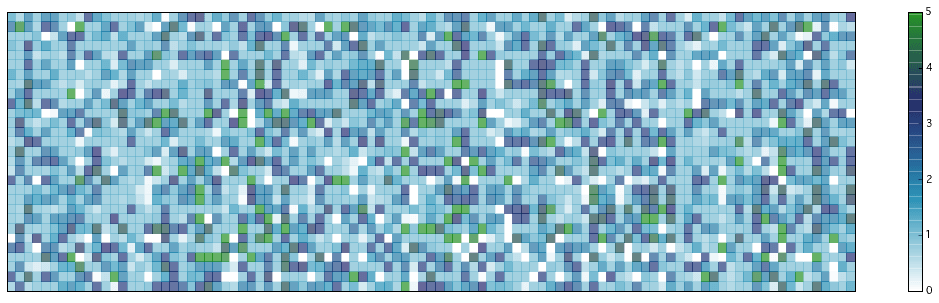
推測した結果を可視化します。前のグラフだと、白い部分(ratingがない部分)が多かったのですが、ほとんどなくなりました!この、空白だったところに数値が入ったところがレコメンデーション情報です。これを一定の閾値を設けて「それ以上ならレコメンドする」、とすれば良いのですね ![]()
fig = plt.figure(figsize=(19,5))
ax = plt.subplot(111)
plt.ylim(0,29)
plt.xlim(0,99)
ax.set_xticks([])
ax.set_yticks([])

cax = ax.pcolor(X, Y, Z, cmap=cm.get_cmap('ocean_r'), alpha=0.6)
cbar = fig.colorbar(cax, ticks=range(6))

plt.show()
最後に、今回の学習の精度を見てみます。もともとratingがあるところに対して、予測した数値がどれくらい離れているか、を平均2乗誤差で測ります。
# 精度の計算
testdata = ratings.map(lambda p: (p[0], p[1]))

predictions = model.predictAll(testdata).map(lambda r: ((r[0], r[1]), limitter(r[2]) ))

ratesAndPreds = ratings.map(lambda r: ((r[0], r[1]), r[2])).join(predictions)

MSE = ratesAndPreds.map(lambda r: (r[1][0] - r[1][1])**2).mean()
print("Mean Squared Error = " + str(MSE))
# 平均2乗誤差
Mean Squared Error = 0.0558736464582
また、結果を数値で見ると下記のようになっています。ratingがあるところは近い数字になっており、Noneのところは予測したratingが入っています。
 ((uid, iid), (rating, predict))
[((29, 17), (3.0, 2.9547048179008057)),
 ((23, 51), (None, 1.421916504776083)),
 ((11, 7), (None, 1.9669319580489901)),
 ((28, 10), (None, 0.06769150007295854)),
 ((9, 93), (None, 2.349846935916598)),
 ((23, 91), (None, 2.597452490149535)),
 ((17, 13), (2.0, 2.0700773308441507)),
 ((16, 38), (1.0, 0.8512992797830536)),
 ((22, 12), (None, 3.331810711043588)),
 ((12, 50), (4.0, 4.095528922729588)),
 ((11, 15), (None, 1.1874705514088135)),
 ((22, 52), (None, 3.4707062021048283)),
 ((0, 14), (None, 0.503229802782621)),
 ((8, 94), (None, 1.0007500227764983)),
 ((29, 89), (None, 0.4272431835442813)),
 ((5, 1), (1.0, 1.2148556310982808)),
 ((4, 42), (None, 1.030942641195369)),
 ((25, 13), (None, 1.5033919417064503)),
 ((3, 55), (None, 2.50649511105159))]
参考
Spark 1.5.0 Machine Learning Library (MLlib) Guide
http://spark.apache.org/docs/latest/mllib-guide.html
MLlib - Collaborative Filtering
http://spark.apache.org/docs/latest/mllib-collaborative-filtering.html
Movie Recommendation with MLlib
https://databricks-training.s3.amazonaws.com/movie-recommendation-with-mllib.html
本記事のコード(GitHub)
https://github.com/matsuken92/Qiita_Contents/blob/master/MLlib_recommendation/Spark_MLlib-recommendation.ipynb