LoginSignup
3
3

More than 5 years have passed since last update.

ggplot2をforで繰り返し作成して一つにまとめる

Posted at

こちらの記事を読んで、気になったので自分なりにやってみました。

library(ggplot2)
library(gridExtra)
plots <- list()
for (i in 1:6) {
  plots[[i]] <- ggplot() +
    geom_point(aes(1:10, rnorm(10)))
}
marrangeGrob(plots, nrow=2, ncol=3, top="")
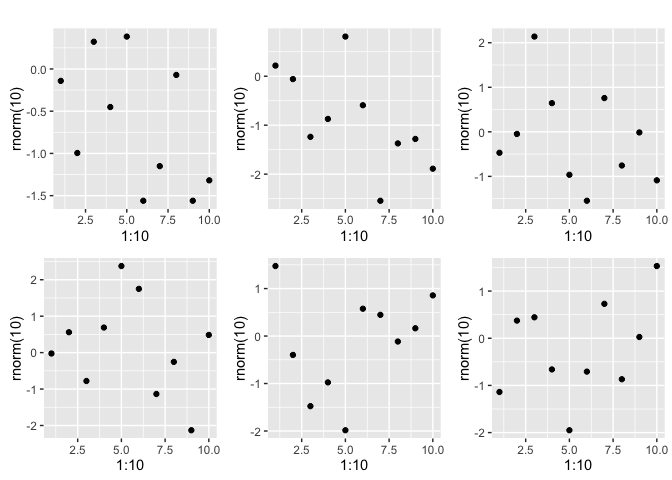
unnamed-chunk-1-1.png

ポイントは、ggplot2()aesは指定せず、こんな感じにすることと、gridExtraパッケージを利用すれば複数plotについても柔軟にできることです。

ただ、gridExtraパッケージは私がまだそこまで使いこなせてないので細かいところはよくわかりません。

以上です。

3
3
0

Register as a new user and use Qiita more conveniently

  1. You get articles that match your needs
  2. You can efficiently read back useful information
  3. You can use dark theme
What you can do with signing up
3
3