LoginSignup
7

More than 5 years have passed since last update.

numpyで作成した行列の可視化

Last updated at Posted at 2014-02-07

interpolation='nearest'で境界がくっきりする。
origin='lower'で縦軸の向きを変えられる。

#coding:utf-8
from pylab import *
import numpy

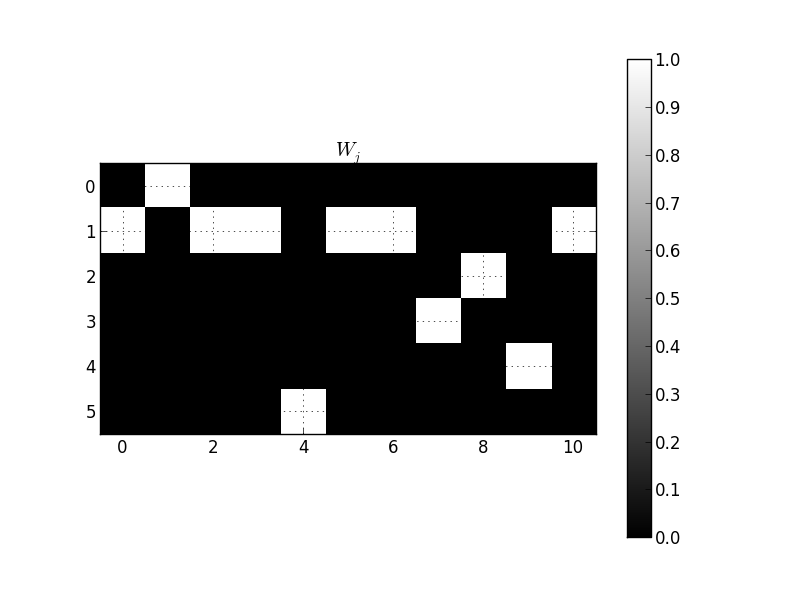
matrixW = numpy.zeros( (6, 11) )

# matrixWに適宜値を入れる

# 可視化
#figure(1)
im = imshow(matrixW, interpolation='nearest') # origin='lower'
title('$W_j$')
colorbar(im) # 色と値の対応を示すカラーバー
grid(True)
gray() # 無記入, gray(), hot()によって色合いが変わる
show()

w_j.jpg

Register as a new user and use Qiita more conveniently

  1. You get articles that match your needs
  2. You can efficiently read back useful information
  3. You can use dark theme
What you can do with signing up
7