現在の日本の生涯未婚率によると、男性の4人に1人、女性の7人に1人は50歳まで一度も結婚したことがなく、そうした人たちの割合は今後も増えていくそうです(出典: ハフィントンポスト)。原因は様々あるようですが、やはり**「適当な相手にめぐり合わない」**という理由は上位に来るようです。
ですが、適当な相手とは、一体全体どういう相手なのでしょうか?
年収、容姿、性格、家、などなど人によって様々相手に求める条件があるものですが、「人の出会いは一期一会」ともいうように、いい相手とめぐり合えたとしても「もしかしたら今後もっといい人と会えるかも……」などとうじうじしているうちに、機会を逃すことも多いかもしれません(涙
この問題は、結婚相手を探しているA君がいるとすると、
- A君は、これから結婚相手の候補となるN人と女性と出会う
- 候補となる相手は、1人ずつ次々に現れる
- 候補となる相手は、それぞれ違うスコアを持つ
- A君は、なるべく高いスコアの人と結婚したい
- 候補となる相手は、A君がYesと言えば結婚できる。だが、残りの候補相手とはもう会えない
- 候補となる相手は、A君がNoと言ってしまうと去り、もう会うことはできない
というルールのゲームに簡略化できます。この問題は、Secretary Problemと呼ばれ、数学的に最適な戦略が存在します。それは、
- 最初の37%の人にはそれがどんなスコアであれNoという
- それ以降の人には、その人のスコアが今までで1番だったらその人に決める
という実に簡単なものです。37%というのは、厳密には 1/e に対応します。この戦略により、候補相手の人数Nによらず、高スコアの相手と結婚できる確率が高まるそうです。
……と聞いても、「ホントかよー」って正直思ってしまいます。どこかで閾値を設定しないといけないのはわかるのですが、37%という半端な数値ではなく、50%とか、もっと待って80%とかの方がいい相手が見つかるような気もします。
今回は、簡単なシミュレーションを使って、この戦略を検証したいと思います。
戦略の実装
Python3を使って計算していきます。まずは、必要なライブラリを入れます。
# import libraries
import random
import numpy as np
import matplotlib.pyplot as plt
import seaborn as sns
メインとなる関数は、候補となる人数と、閾値を作るまでに出会う人数をインプットとして、初めて閾値を超えた相手を選ぶようにします。その相手のランクとスコアを、アウトプットします。候補相手のスコアは、0から100のランダムな整数値を取るとします。
# function to find a partner based on a given decision-time
def getmeplease(rest, dt, fig):
    ## INPUT: rest ... integer representing the number of the fixed future encounters
    #         dt ... integer representing the decision time to set the threshold
    #         fig ... 1 if you want to plot the data
    # ++++++++++++++++++++++++++++++++++++++++++++++++++++++++++++++++

    # score ranging from 0 to 100
    scoremax = 100
    #random.seed(1220)

    # sequence of scores
    distribution = random.sample(range(scoremax), k=rest)

    # visualize distribution
    if fig==1:
        # visualize distribution of score
        plt.close('all')
        plt.bar(range(1,rest+1), distribution, width=1)
        plt.xlabel('sequence')
        plt.ylabel('score')
        plt.xlim((0.5,rest+0.5))
        plt.ylim((0,scoremax))
        plt.xticks(range(1, rest+1))

    # remember the highest score among the 100 x dt %
    if dt > 0:
        threshold = max(distribution[:dt])
    else:
        threshold = 0

    # pick up the first one whose score exceeds the threshold
    partner_id = 1
    partner_score = distribution[0]
    t = dt
    for t in range(dt+1, rest):
        if partner_score < threshold:
            partner_score = distribution[t]
        else:
            partner_id = t
            break
    else:
        partner_score = distribution[-1]
        partner_id = rest

    # get the actual ranking of the partner
    array = np.array(distribution)
    temp = array.argsort()
    ranks = np.empty(len(array), int)
    ranks[temp] = np.arange(len(array))
    partner_rank = rest - ranks[partner_id-1]

    # visualize all
    if fig==1:
        plt.plot([decisiontime+0.5,decisiontime+0.5],[0,scoremax],'--k')
        plt.bar(partner_id,partner_score, color='g', width=1)

    return [partner_id, partner_score, partner_rank]
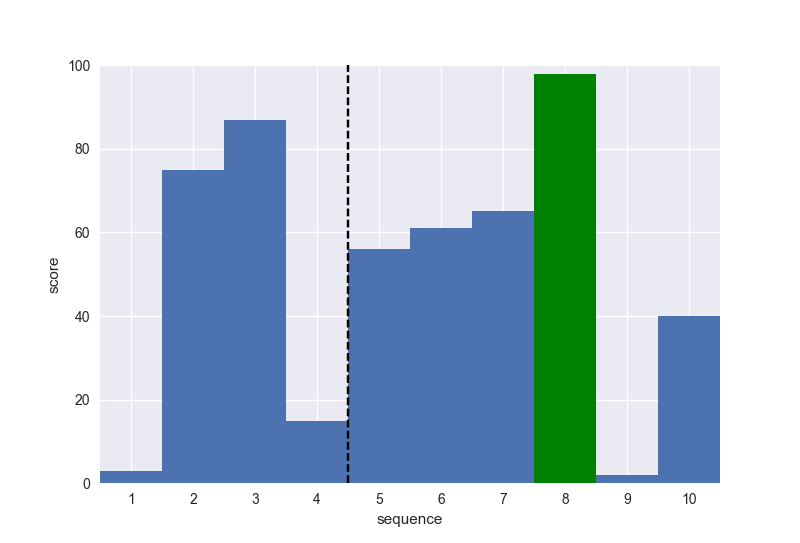
例えば、候補人数を10人、閾値を作るまでに出会う人の数をその約37%の4人だとすると、この関数 getmeplease(10,4,1)は以下のようなグラフを描きます。
……10人のうち、8番目に現れた最もスコアの高い人と結婚できましたー((((oノ´3`)ノ すごーい(白い目
シミュレーション
出会う人数Nを5, 10, 20, 100と4パターン用意します。同様に、閾値を作るまでに出会う人数を、全体の10%, 37%, 50%, 80%、と変えたときの4パターンの戦略を用意し、比べたいと思います。
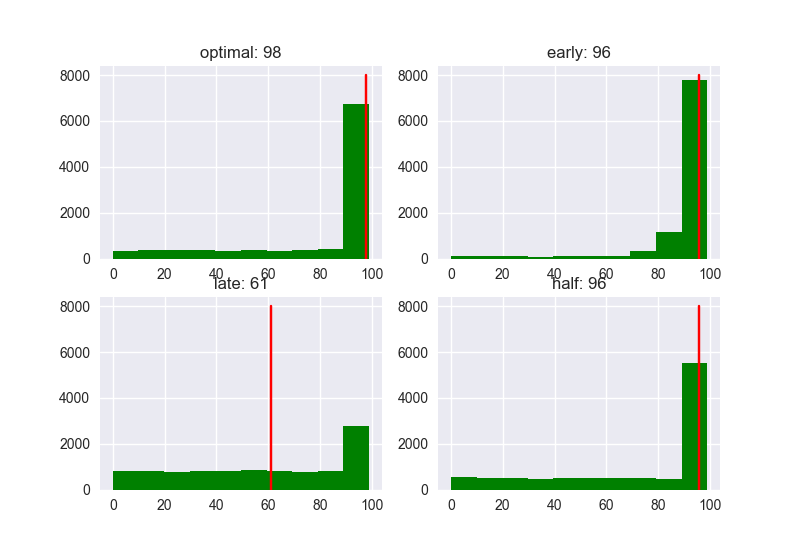
以下の関数では、それぞれの戦略("optimal": 37%、"early": 10%、"late": 80%、"half": 50%)を10000回シミュレーションし、選ばれた相手のランクとスコアのヒストグラムを作り、中央値を求めます。
# parameters
repeat = 10000
rest = [5,10,20,100]
opt_dt = [int(round(x/np.exp(1))) for x in rest]
tooearly_dt = [int(round(x*0.1)) for x in rest]
toolate_dt = [int(round(x*0.8)) for x in rest]
half_dt = [int(round(x*0.5)) for x in rest]

# initialization
opt_rank = np.zeros(repeat*len(rest))
early_rank = np.zeros(repeat*len(rest))
late_rank = np.zeros(repeat*len(rest))
half_rank = np.zeros(repeat*len(rest))
opt_score = np.zeros(repeat*len(rest))
early_score = np.zeros(repeat*len(rest))
late_score = np.zeros(repeat*len(rest))
half_score = np.zeros(repeat*len(rest))

# loop to find the actual rank and score of a partner
k = 0
for r in range(len(rest)):
    for i in range(repeat):
        # optimal model
        partner_opt = getmeplease(rest[r], opt_dt[r], 0)
        opt_score[k] = partner_opt[1]
        opt_rank[k] = partner_opt[2]

        # too-early model
        partner_early = getmeplease(rest[r], tooearly_dt[r], 0)
        early_score[k] = partner_early[1]
        early_rank[k] = partner_early[2]

        # too-late model
        partner_late = getmeplease(rest[r], toolate_dt[r], 0)
        late_score[k] = partner_late[1]
        late_rank[k] = partner_late[2]

        # half-time model
        partner_half = getmeplease(rest[r], half_dt[r], 0)
        half_score[k] = partner_half[1]
        half_rank[k] = partner_half[2]

        k += 1

# visualize distributions of ranks of chosen partners
plt.close('all')
begin = 0
for i in range(len(rest)):
    plt.figure(i+1)

    plt.subplot(2,2,1)
    plt.hist(opt_rank[begin:begin+repeat],color='blue')
    med = np.median(opt_rank[begin:begin+repeat])
    plt.plot([med, med],[0, repeat*0.8],'-r')
    plt.title('optimal: %i' %int(med))

    plt.subplot(2,2,2)
    plt.hist(early_rank[begin:begin+repeat],color='blue')
    med = np.median(early_rank[begin:begin+repeat])
    plt.plot([med, med],[0, repeat*0.8],'-r')
    plt.title('early: %i' %int(med))

    plt.subplot(2,2,3)
    plt.hist(late_rank[begin:begin+repeat],color='blue')
    med = np.median(late_rank[begin:begin+repeat])
    plt.plot([med, med],[0, repeat*0.8],'-r')
    plt.title('late: %i' %int(med))

    plt.subplot(2,2,4)
    plt.hist(half_rank[begin:begin+repeat],color='blue')
    med = np.median(half_rank[begin:begin+repeat])
    plt.plot([med, med],[0, repeat*0.8],'-r')
    plt.title('half: %i' %int(med))

    fig = plt.gcf()
    fig.canvas.set_window_title('rest' + ' ' + str(rest[i]))

    begin += repeat

    plt.savefig(figpath + 'rank_' + str(rest[i]))

begin = 0
for i in range(len(rest)):
    plt.figure(i+10)

    plt.subplot(2,2,1)
    plt.hist(opt_score[begin:begin+repeat],color='green')
    med = np.median(opt_score[begin:begin+repeat])
    plt.plot([med, med],[0, repeat*0.8],'-r')
    plt.title('optimal: %i' %int(med))

    plt.subplot(2,2,2)
    plt.hist(early_score[begin:begin+repeat],color='green')
    med = np.median(early_score[begin:begin+repeat])
    plt.plot([med, med],[0, repeat*0.8],'-r')
    plt.title('early: %i' %int(med))

    plt.subplot(2,2,3)
    plt.hist(late_score[begin:begin+repeat],color='green')
    med = np.median(late_score[begin:begin+repeat])
    plt.plot([med, med],[0, repeat*0.8],'-r')
    plt.title('late: %i' %int(med))

    plt.subplot(2,2,4)
    plt.hist(half_score[begin:begin+repeat],color='green')
    med = np.median(half_score[begin:begin+repeat])
    plt.plot([med, med],[0, repeat*0.8],'-r')
    plt.title('half: %i' %int(med))

    fig = plt.gcf()
    fig.canvas.set_window_title('rest' + ' ' + str(rest[i]))

    begin += repeat

    plt.savefig(figpath + 'score_' + str(rest[i]))
N = 20の場合
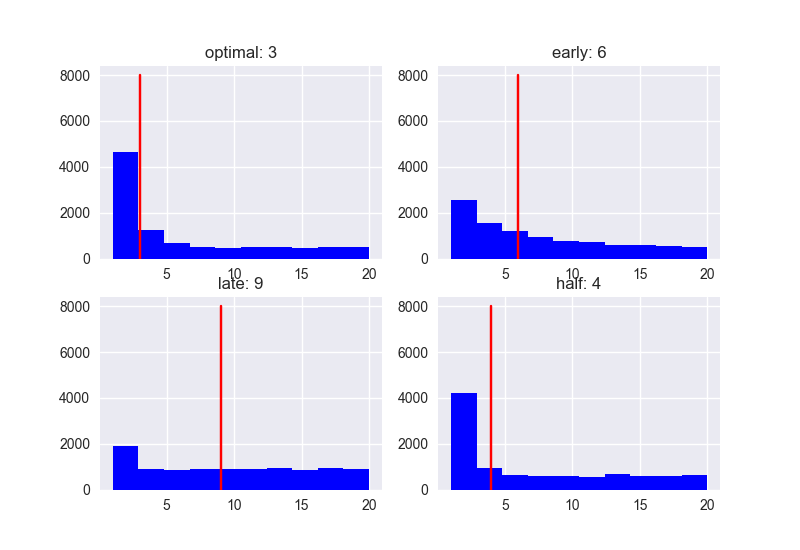
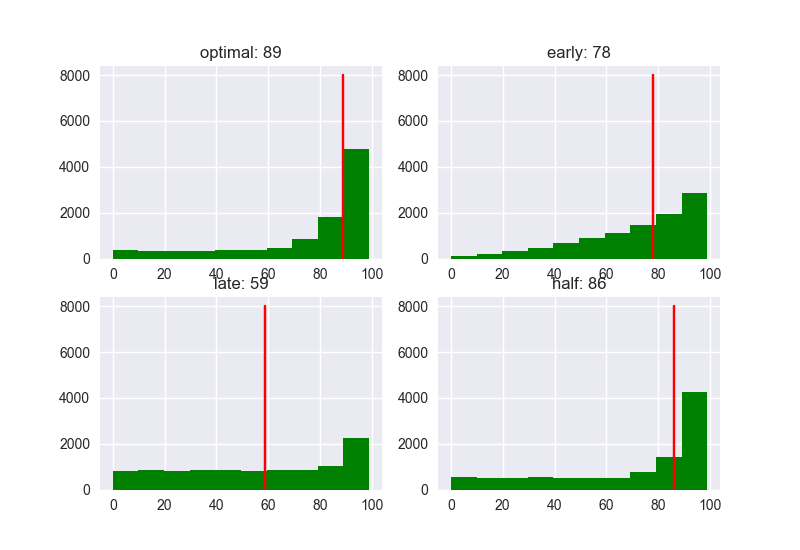
20人と会う場合、スコアとランクの分布は以下のようになりました。
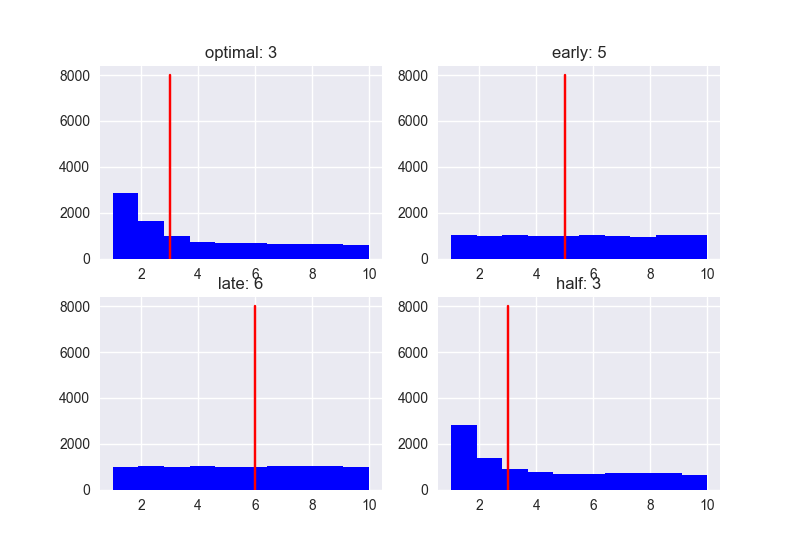
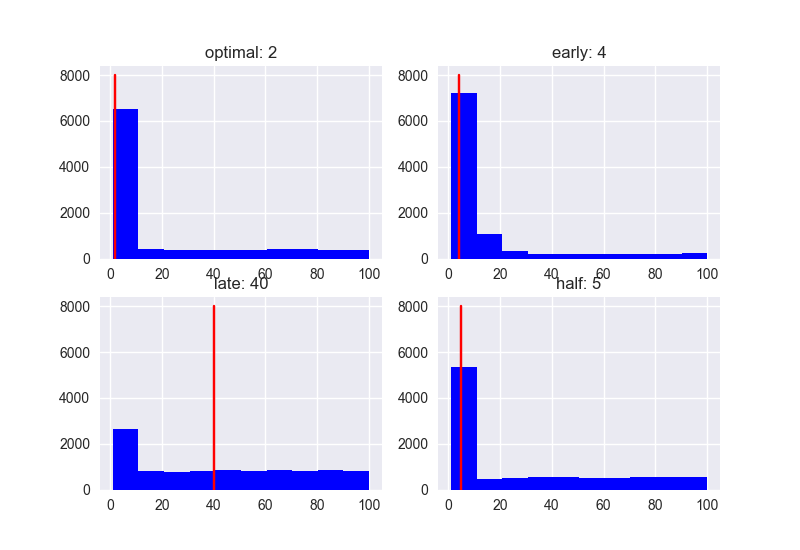
Optimalな戦略(37%)を採用した場合、ランクの中央値は3になりました。「最初の37%にはNo、その後一番スコアの高い人にYes」という戦略で臨めば、高確率で自分が出会うことが可能な人のうち、3番目以内の人と結婚できることになります。
ちなみに、Early (10%)、Half (50%)での中央値はそれぞれ6、4ですので、決して悪くはない(?)ですね。Late (80%)ですと、中央値が9ですので、まぁ、ちょっと失敗する確率は高くなります。。。
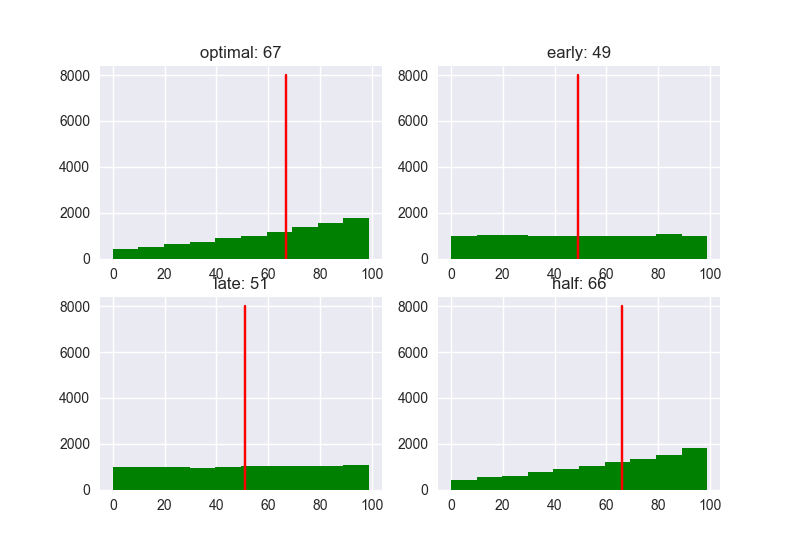
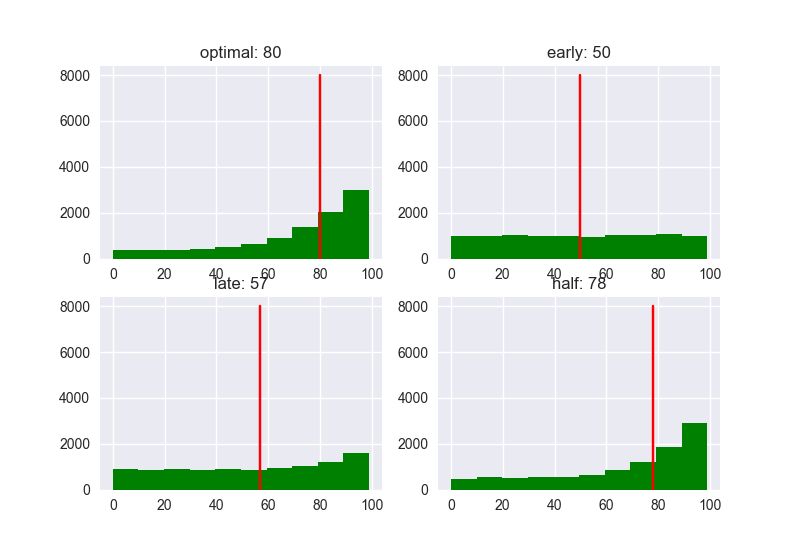
Optimalな戦略(37%)を採用した場合、スコアの中央値は89になりました。他の戦略では、Early (10%)が78、Late (80%)が59、Half (80%)が86ですので、やはり、閾値を1/eに決めたときのパフォーマンスは高いですね。よりいい人に決まりやすくなるようです。最適な戦略は必ずしも最適な解を導きませんが、最適な解に近づく可能性を上げることはできます。
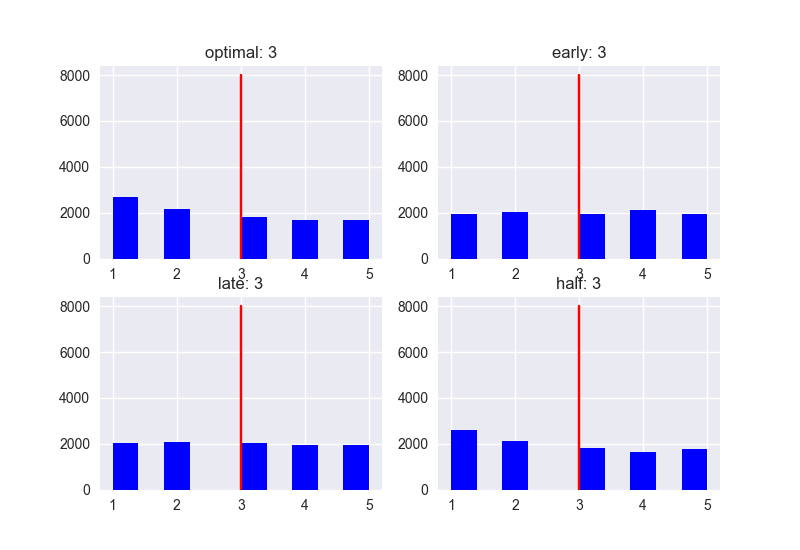
おまけとして、候補人数が5人、10人、100人の場合も載せておきます。
N = 5
N = 10
N = 100
明らかな傾向として、候補人数が増えるにつれ特に"late"のパフォーマンスは悪くなっていますね。候補人数が少ないと、戦略によるパフォーマンスの違いこそ少ないですが、スコアの値は低くなりがちです。どの場合でも、全体の37%の人と最初に会って閾値を決める戦略が、高ランク高スコアの相手に決まる可能性が高いようです。
結論
- 候補人数が多いほど、よりよい相手と巡り合える傾向がある
- ただし、「もっとよく考えてから……」とぐだぐだしていると、機会を損失するだけでなく、最終的に決まる人のスコアも悪くなる
- だからといって早すぎてもよくない
- 今後出会う人数を決め、その1/eの人と会って閾値を決め、その後初めて閾値を超えた人に決めるのが最適な戦略の模様
注意 ##
- 現実には、こちらがYesと言っても相手にNoと言われる場合が多い
-
休みの日に家でコード書いているような人はそもそも候補がいないことも多い - 最適な戦略を採用したからといって、最適な解が得られるわけではない
……がんばりましょう!
