Intro
仕事でES/td-agentを触ることが多くなりローカルマシンでも
テスト環境が必要になったのでその構築メモになります。(Vagrant上のCentOS6.5)
ローカルApacheのログをサンプルにtd-agentとESの連携もしてみます。
環境
- Centos6.5(Vagrant on Mac)
- ElasticSearch 1.3.6
- td-agent 0.10.55
前提
VMはまっさらの状態です。
rootで作業してます。
手順めも
1.Developer Toolのインストール
あとでfluentのplugin入れるときに困るので入れておきます。
gccとかその他たくさん入ります。
yum groupinstall "Development Tools"
yum install libcurl-devel #これ入れてないとだめだった
2.JDKのインストール
http://www.oracle.com/technetwork/java/javase/downloads/index.html
Oracleのjdk-7u71を使います。Macでダウンロードして
共有フォルダでvagrant側にコピーして使います。
rpm -ivh jdk-7u71-linux-x64.rpm
$ java -version
java version "1.7.0_71"
3.Apacheのインストール
yum install httpd
chkconfig httpd on
chkconfig --list | grep httpd
service httpd start
4.ElasticSearchのインストール
仕事の都合上1.3.6を入れるのでES公式からrpm落としてきて入れます。
wget https://download.elasticsearch.org/elasticsearch/elasticsearch/elasticsearch-1.3.6.noarch.rpm
rpm -ivh elasticsearch-1.3.6.noarch.rpm
chkconfig --add elasticsearch
chkconfig elasticsearch on
service elasticsearch start
tail -f /var/log/elasticsearch/elasticsearch.log
起動が確認できればOK
5.ElasticSearchのプラグインをインストールする
cd /usr/share/elasticsearch/
marvel
管理・モニター用のプラグイン
./bin/plugin -install elasticsearch/marvel/latest
インストール後起動すれば下記でみれます。
http://{vagrantのIP}:9200/_plugin/marvel/
Head
ElasticSearchの操作GUIプラグイン
./bin/plugin -install mobz/elasticsearch-head
インストール後起動すれば下記でみれます。
http://{vagrantのIP}:9200/_plugin/head/
kuromoji
日本語解析プラグイン
ES1.3系だと2.3.0をいれないといけないみたいです。
https://github.com/elasticsearch/elasticsearch-analysis-kuromoji
./bin/plugin -install elasticsearch/elasticsearch-analysis-kuromoji/2.3.0
inquisitor
クエリのデバックなど
./bin/plugin -install polyfractal/elasticsearch-inquisitor
インストール後起動すれば下記でみれます。
http://{vagrantのIP}:9200/_plugin/inquisitor/#/
6.kibanaのインストール
plugin経由ではなくApache経由で見えるようにします。
curl -sL https://download.elasticsearch.org/kibana/kibana/kibana-3.1.2.tar.gz | sudo tar zxf - -C /var/www/html
mv /var/www/html/kibana-3.1.2 /var/www/html/kibana
http://{vagrantのIP}/kibana/index.html
でkibanaがみれればOK
7.td-agentのインストール前の初期設定
公式サイトをみるとos側のパラメータ変更が必要なので事前にやっておく
http://docs.fluentd.org/ja/articles/before-install
#下記を追加
root soft nofile 65536
root hard nofile 65536
* soft nofile 65536
* hard nofile 65536
#下記を追加
net.ipv4.tcp_tw_recycle = 1
net.ipv4.tcp_tw_reuse = 1
net.ipv4.ip_local_port_range = 10240    65535
サーバを再起動する。
8.td-agentのインストール
インストールも公式を参考にshを実行
http://docs.fluentd.org/ja/articles/install-by-rpm
curl -L http://toolbelt.treasuredata.com/sh/install-redhat.sh | sh
chkconfig td-agent on
chkconfig --list | grep td-agent
service td-agent start
tail -f /var/log/td-agent/td-agent.log
正常に起動すればOK
9.td-agentのプラグインインストール
必要なもの + 便利なプラグインのインストール
-
fluent-plugin-rewrite-tag-filter
- レコードの内容によりタグを変更するプラグイン
-
fluent-plugin-record-reformer
- タグの情報をレコードの内容に変換するプラグイン
-
fluent-plugin-rewrite
- レコードの内容により値を書換(無視したり、値を書き換えたり)
-
fluent-plugin-parser
- レコードを正規表現でparseして値に入れ込んだり、フォーマット変更したり。
-
fluent-plugin-tail-ex
- in_tailプラグインの拡張。tail先をワイルドカードで指定が可能に。
-
fluent-plugin-typecast
- データの型を変換するプラグイン
-
fluent-plugin-forest
- タグ毎にOutputプラグインのスレッドを自動的に生成してくれる。
- わかりやすいのでここをどうぞ
-
fluent-plugin-filter
- allow/denyでレコードをfilterをしてくれる。
-
fluent-plugin-multiprocess
- fluentをマルチプロセス化するプラグイン
-
fluent-plugin-elasticsearch
- elasticsearchにデータを送るためのプラグイン
cd /usr/lib64/fluent/ruby/bin/
./fluent-gem install fluent-plugin-rewrite-tag-filter --no-ri --no-rdoc -V
./fluent-gem install fluent-plugin-rewrite --no-ri --no-rdoc -V
./fluent-gem install fluent-plugin-elasticsearch --no-ri --no-rdoc -V
./fluent-gem install fluent-plugin-parser --no-ri --no-rdoc -V
./fluent-gem install fluent-plugin-tail-ex --no-ri --no-rdoc -V
./fluent-gem install fluent-plugin-record-reformer --no-ri --no-rdoc -V
./fluent-gem install fluent-plugin-typecast --no-ri --no-rdoc -V
./fluent-gem install fluent-plugin-forest --no-ri --no-rdoc -V
./fluent-gem install fluent-plugin-filter --no-ri --no-rdoc -V
./fluent-gem install fluent-plugin-multiprocess --no-ri --no-rdoc -V
10.ElasticSearchとtd-agentの連携
ローカルのApacheのログを取り込む設定をしてみます。
apacheのlogをtd-agentの起動ユーザでみれるようにします。
chown -R td-agent:td-agent /var/log/httpd/
ESのテンプレート作作成
フィールド定義がめんどくさいのでdynamic template使い、すべてStringで定義しちゃいます。
curl -XPUT 'http://localhost:9200/_template/itopantest01' -d '
{
  "template": "itopantest01-*",
  "mappings": {
    "_default_": {
      "dynamic_templates": [{
        "string_with_raw": {
          "match": "*",
          "match_mapping_type": "string",
          "mapping": {
            "type": "string",
            "fields": {
              "raw": {
                "type": "string",
                "index": "not_analyzed"
              }
            }
          }
        }
      }]
    }
  }
}
'
{"acknowledged":true}」と表示されることを確認
td-agent側の設定
client
path
method
size
context
.
.
みたいにフィールドをキチンと分けて検索できるように登録します。
apache2フォーマットでparseされたものから追加ででurlのqueryや
contextなども集計したいので途中で分解する処理が入っています。
先ほどいれたpluginも織り交ぜてconfigを書いてみます。
# Input
# ローカルのアクセスログを監視する
<source>
  type tail
  path /var/log/httpd/access_log
  format apache2
  pos_file /var/log/td-agent/itopantest01_access_log.pos
  tag raw.apache.itopantest01.access
</source>

# アクセスログのパス部分からクエリ文字列を分離する
#  raw.apache.itopantest01.access
#    -> separated.apache.itopantest01.access
<match raw.**>
  type parser
  reserve_data yes
  key_name path
  format /^(?<path>[^?]+)(\?(?<query>.+))?$/
  tag separated.apache.itopantest01.access
</match>

# アクセスログのパス部分からコンテキストを抽出する
#
# separated.apache.itopantest01.access.**
#   -> separated2.apache.itopantest01.access.**
<match separated.**>
  type parser
  reserve_data yes
  key_name path
  format /^(?<context>/[^/]*).*$/
  tag separated2.apache.itopantest01.access
</match>

# sizeフィールドをintegerにキャストする
#
# separated2.apache.itopantest01.access.**
#   -> casted.apache.itopantest01.access.**
#
<match separated2.**>
   type typecast
   item_types size:integer
   tag casted.apache.itopantest01.access
</match>

# ホスト名を追加する
# apache2フォーマットでhostとして解析されていた
# フィールドはクライアントIPなのでclientフィールドに変換する。
# casted.apache.itopantest01.access.**
#   -> toelastic.apache.itopantest01.access.**
#
<match casted.**>
  type record_reformer
  renew_record false
  enable_ruby false
  <record>
    client ${host}
    host ${hostname}
  </record>
  tag toelastic.apache.itopantest01.access
</match>

#
# elasticsearchに登録する
#
<match toelastic.apache.itopantest01.access.**>
  type elasticsearch
  host localhost
  port 9200
  type_name itopantest01 #type名。なんでもよい
  include_tag_key true
  logstash_format true
  logstash_template itopantest01 #さっき指定したtemplate名
  logstash_prefix itopantest01 #ここでindex名が指定できます。
  buffer_type file
  buffer_path /var/log/td-agent/tmp/out_elasticsearch.*.buffer
  buffer_chunk_limit 8m
  buffer_queue_limit 256
  flush_interval 10s
  retry_limit 17
  retry_wait 1s
</match>
td-agentを再起動。
確認
td-agentのログも見つつローカルのkibanaを適当にアクセス後、
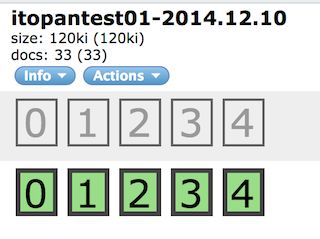
headプラグインのOverviewやbrowserでindexが確認できればOK
Overview
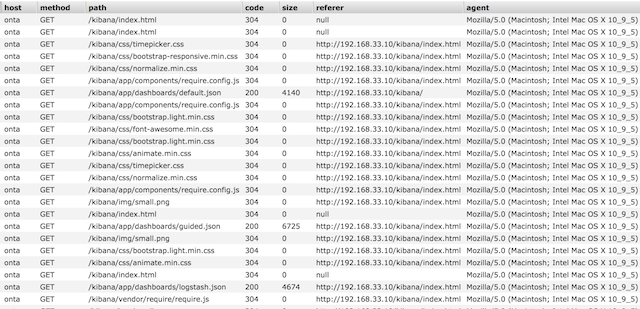
Browser
フィールドもキチンと分かれてますね。
あとはkibanaでできたindexを指定してグラフ化するなり楽しい世界が待っています。
参考URL
http://www.oracle.com/technetwork/java/javase/downloads/index.html
http://www.elasticsearch.org/overview/kibana/installation/
http://qiita.com/harukasan/items/0e69f5c17f12db7b2e98
http://blog.kentarok.org/entry/2012/07/01/000518
http://d.hatena.ne.jp/tagomoris/20120410/1334040981
http://muddydixon.hatenablog.com/entry/2012/08/31/144853
http://docs.fluentd.org/articles/in_multiprocess