やりたいこと
matplotlibのsubplotで描画した全ての軸に対して、グリッドやラベルなど共通の設定をしたい。
やり方 1
- 軸の一覧を取得する。
- 軸毎にループ
- 現在の軸を変更
# 1. 軸の一覧取得
axs = plt.gcf().get_axes()

# 2. 軸毎にループ
for ax in axs:
    # 3. 現在の軸を変更
    plt.axes(ax)
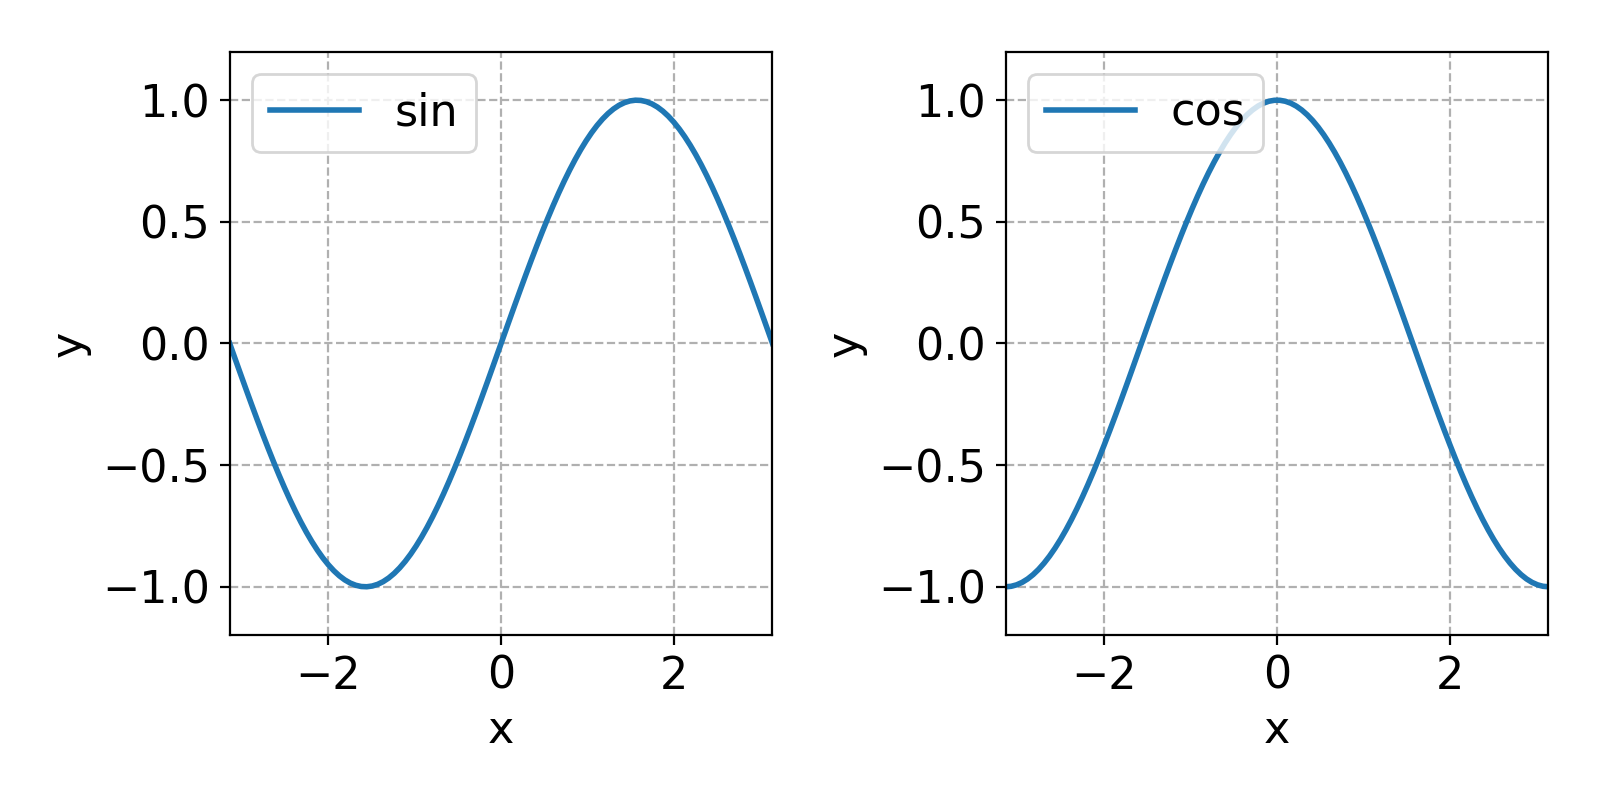
コード例
import matplotlib.pyplot as plt
import numpy as np

# データ
x  = np.linspace(-np.pi, np.pi, 100)
y1 = np.sin(x)
y2 = np.cos(x)

# figure
plt.figure(figsize=(8,4))

# プロット1
plt.subplot(1,2,1)
plt.plot(x,y1,label='sin')

# プロット2
plt.subplot(1,2,2)
plt.plot(x,y2,label='cos')

# 軸の一覧取得
axs = plt.gcf().get_axes()

# 軸毎にループ
for ax in axs:
    # 現在の軸を変更
    plt.axes(ax)

    # 凡例を表示
    plt.legend(loc=2)

    # グリッド
    plt.grid(linestyle='--')

    # 軸ラベル
    plt.xlabel('x')
    plt.ylabel('y')

    # 軸の範囲
    plt.xlim([-np.pi, np.pi])
    plt.ylim([  -1.2,   1.2])

# 図の調整
plt.tight_layout()
やり方 2
- データとラベル等をリストにする。
- enumerateを使ってループ
- plt.subplotは+1するのを忘れない
# 1. データとラベル等をリストにする。
Y    = [y1, y2]
lbls = ['sin', 'cos']

# 2. enumerateを使ってループ
for i, y in enumerate(Y):

    # 3. plt.subplotは+1するのを忘れない
    plt.subplot(1,2,i+1)
コード例 2
# figure
plt.figure(figsize=(8,4))
# list
Y    = [y1, y2]
lbls = ['sin', 'cos']

for i, y in enumerate(Y):
    # サブプロット
    plt.subplot(1,2,i+1)

    # プロット
    plt.plot(x,y,label=lbls[i])

    # 凡例を表示
    plt.legend(loc=2)

    # グリッド
    plt.grid(linestyle='--')

    # 軸ラベル
    plt.xlabel('x')
    plt.ylabel('y')

    # 軸の範囲
    plt.xlim([-np.pi, np.pi])
    plt.ylim([  -1.2,   1.2])

# 図の調整
plt.tight_layout()
以下補足情報
gca, gcf
plt.gcf()で現在のfigureを、plt.gca()で現在のaxesを取得できる。またplt.axes()で現在の軸を指定できる。
階層構造
matplotlibのfigureは、MATLABと同じく以下の図のように階層構造になっている。
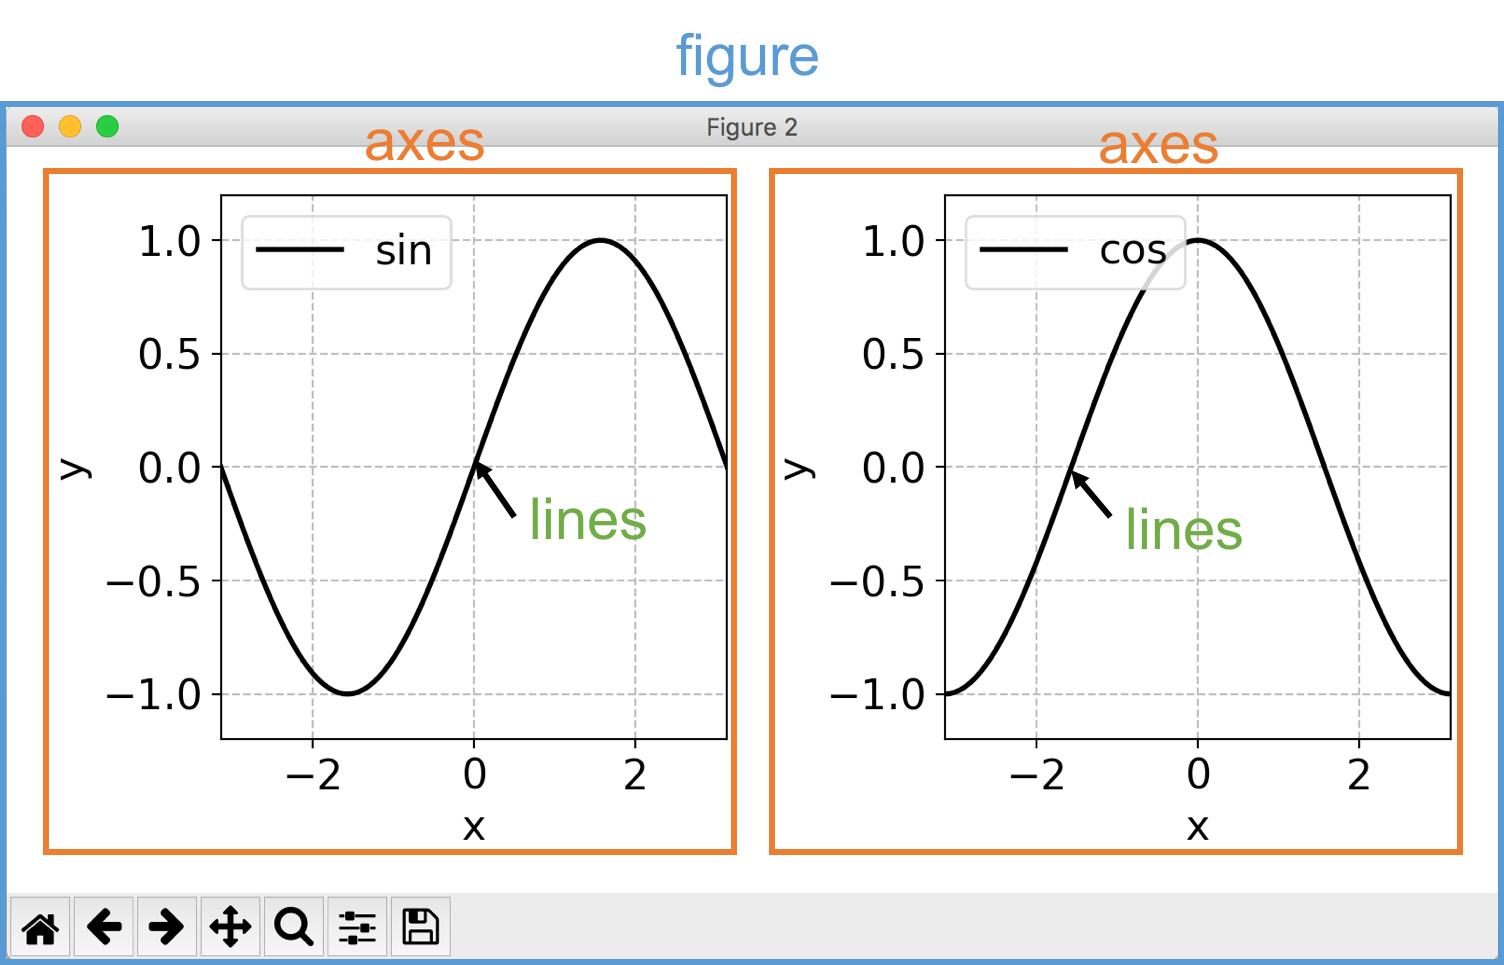
figureの中にaxesがあり、axesの中にlinesがある。plt.gcf().get_axes()で現在のfigureにある全ての軸をリストで取得できる。他にはplt.gca().get_lines()だと現在のaxesにある全てのlinesを取得できる。