概要
CentOS6.9でperfコマンドを使ってみたメモ
参考
perf is 何
- Performance analysis tools for Linux
- 参考のリンクがとても詳しい
なぜ使うのか
システムコールから先のカーネルのどこでボトルネックになっているかなどを知りたい場合
導入
yumでサクッとインストールできる。
yum install perf
使い方
-
プロファイルの実行
perf record -ag
-
結果を保存
-
結果の確認
perf report -g -G --stdio
コマンド
perf [サブコマンド]
サブコマンド
perf-stat(1), perf-top(1), perf-record(1), perf-report(1), perf-list(1)
man perf-サブコマンドでmanが見れる
コマンド使ってみる
perf top
- 関数単位でcpu使用率を閲覧
- 共有ライブラリのシンボルは16進数で読めない。
kernel-debuginfoなどインストールしていないがカーネルシンボルが読める。共有ライブラリもシンボルが見れるものがある、なぜでしょうか><?????
Samples: 72K of event 'cpu-clock', Event count (approx.): 2471353254
Overhead  Shared Object             Symbol
   3.76%  [kernel]                  [k] find_vma
   3.56%  [kernel]                  [k] __d_lookup
   2.44%  [kernel]                  [k] avc_has_perm_noaudit
   2.42%  [kernel]                  [k] __link_path_walk
   2.39%  libjvm.so                 [.] 0x00000000004743a3
   1.89%  [kernel]                  [k] prof_syscall_enter
   1.72%  [kernel]                  [k] inode_has_perm
   1.64%  libc-2.12.so              [.] mkfifo
   1.34%  [kernel]                  [k] selinux_inode_permission
   1.23%  [kernel]                  [k] finish_task_switch
   1.04%  [kernel]                  [k] kmem_cache_alloc
   0.87%  [kernel]                  [k] system_call
   0.84%  [kernel]                  [k] syscall_trace_enter
   0.80%  [kernel]                  [k] strncpy_from_user
   0.74%  [kernel]                  [k] __do_softirq
   0.66%  [kernel]                  [k] acl_permission_check
   0.61%  [kernel]                  [k] do_lookup
   0.54%  libjvm.so                 [.] 0x000000000065af65
   0.53%  libc-2.12.so              [.] memcpy
   0.51%  [kernel]                  [k] follow_managed
   0.47%  [kernel]                  [k] audit_syscall_entry
   0.44%  libjvm.so                 [.] 0x00000000009ff88c
   0.43%  [kernel]                  [k] dput
   0.43%  libjvm.so                 [.] 0x00000000006c1c56
   0.42%  [kernel]                  [k] _atomic_dec_and_lock
   0.41%  perf                      [.] hists__output_resort
   0.41%  libjvm.so                 [.] 0x000000000032ef1e
perf list
- 調査可能なイベント一覧
- 出力されたイベントは他のサブコマンドの-eオプションで指定できる
# perf list | more

List of pre-defined events (to be used in -e):

  alignment-faults                                   [Software event]
  context-switches OR cs                             [Software event]
  cpu-clock                                          [Software event]
  cpu-migrations OR migrations                       [Software event]
  dummy                                              [Software event]
  emulation-faults                                   [Software event]
  major-faults                                       [Software event]
  minor-faults                                       [Software event]
  page-faults OR faults                              [Software event]
  task-clock                                         [Software event]

  rNNN                                               [Raw hardware event descriptor]
  cpu/t1=v1[,t2=v2,t3 ...]/modifier                  [Raw hardware event descriptor]
   (see 'man perf-list' on how to encode it)

  block:block_bio_backmerge                          [Tracepoint event]
- 他のコマンドで
-e block:block_bio_backmergeみたいに指定してパフォーマンスを測定できる。 perf stat -e block:block_bio_backmerge -p プロセス番号- perf Examples にイベントの詳しい一覧図がある
- イベントをピンポイントで計測可能。負荷調査などで大体のボトルネックの箇所がわかっていて、ピンポイントで調べたいときに便利そう
- 詳しく使ってないのでなんともですが、他のコマンドでは測定できない箇所を調べられるのがよさそう
perf stat
perf-stat - Run a command and gather performance counter statistics
システムコールをイベント指定して使ってみた
$ perf stat -e 'syscalls:sys_enter_gettimeofday' -p 3887
^C
 Performance counter stats for process id '3887':

               592      syscalls:sys_enter_gettimeofday

       0.772927115 seconds time elapsed
ハードウェアイベント関連
perf stat -e cycles,instructions,cache-references,cache-misses,bus-cycles -a sleep 10

 Performance counter stats for 'system wide':

    12,660,287,860      cycles                                                        (100.00%)
     6,503,412,662      instructions              #    0.51  insns per cycle          (100.00%)
       239,947,605      cache-references                                              (100.00%)
         9,235,423      cache-misses              #    3.849 % of all cache refs      (100.00%)
       435,088,963      bus-cycles

      10.000614024 seconds time elapsed
- 利用できるカウンタは、プロセッサのアーキテクチャによって決まり、プロセッサのマニュアル(たとえば、Interlの「ソフトウェアデベロッパーズ・マニュアル」にドキュメントされている。)
KVM上のハードウェア関連のイベントをいくつか試したがnot supprot。なぜだろう?
$ perf stat -e cycles,instructions,cache-references,cache-misses,bus-cycles -a sleep 10

 Performance counter stats for 'system wide':

   <not supported>      cycles
   <not supported>      instructions
   <not supported>      cache-references
   <not supported>      cache-misses
   <not supported>      bus-cycles

      10.011931754 seconds time elapsed
Linuxパフォーマンスを記録してみる
システム全体を調査
perf record -ag
-a, --all-cpus
          System-wide collection from all CPUs.
-g, --call-graph
          Do call-graph (stack chain/backtrace) recording.
- デフォルトだとカレントディレクトリに
perf.dataとして保存される
コマンドも指定できる
個々のプロセスを対象にすることもできる
perf record -- [コマンド]
結果の確認
perf report -g -G --stdio
- -Gをつけないと関数名が16進数表示になる
- --stdioで標準出力
- -gは今回だと特につけてもつけなくても変わらないように見えた。値を指定すると変わるのか、今度試す。
結果
# To display the perf.data header info, please use --header/--header-only options.
#
# Samples: 5K of event 'cpu-clock'
# Event count (approx.): 59969696370
#
# Children      Self  Command          Shared Object       Symbol
# ........  ........  ...............  ..................  .......................................
#
    48.02%    48.02%  swapper          [kernel.vmlinux]    [k] native_safe_halt
                    |
                    ---native_safe_halt

     6.30%     0.35%  java             libc-2.12.so        [.] mkfifo
                       |
                       ---mkfifo
                          |
                          |--16.04%-- __d_lookup
                          |
                          |--12.83%-- avc_has_perm_noaudit
                          |
                          |--9.09%-- __link_path_walk
                          |
                          |--5.88%-- inode_has_perm
                          |
                          |--4.01%-- acl_permission_check
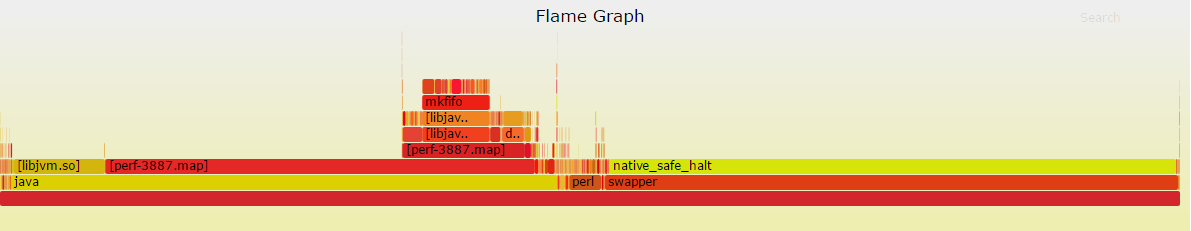
フレームグラフ
- perf実行結果からスタックフレームをグラフにできる。視覚化され、CPUの使用状況を素早く明確に理解できる
- グラフの見方など perf + Flame Graphs で Linux カーネル内のボトルネックを特定する
フレームグラフ作成方法
以下にperfとsystemtapでのCPUフレームグラフの作成方法が載ってた
CPU Flame Graphs
# git clone https://github.com/brendangregg/FlameGraph  # or download it from github
# cd FlameGraph
# perf record -F 99 -a -g -- sleep 60
# perf script | ./stackcollapse-perf.pl > out.perf-folded
# ./flamegraph.pl out.perf-folded > perf-kernel.svg
まとめ
vmstatなどで負荷調査。SystemのCPU使用率高いー
↓
straceでシステムコールみてみる。あーなんか沢山時間使ってるシステムコールあるー。でもシステムコールから先のカーネルのどこで時間使ってるかわからないー。でも知りたいー。
↓
私にはperfがある!!
↓
perf topでどのカーネル関数がCPU上で沢山使われてるのかー
↓
perf recordとperf repotで詳しいコールグラフみて、どの流れでCPU沢山つかっているんやろーを把握。問題となる関数を把握。
↓
カーネルソース見ながらもくもく静的解析して原因究明。対策実施。
次はSystemTap