目的
Kaggleのサイトで、とある方のソースコードを参照し、それの見方を私なりに理解しようと思いまして、ここに記録致します。
環境はPython 3、matplotlibとpandasを利用しています。
今回は対数(log)について私なりに理解しようと思います。
対数(log)を社会人になって10年1度も使ったことがありません。
学生のときに勉強した薄い記憶だけはあります。
そこでなぜ対数(log)が必要かを調べてみました。
地震の震度とマグニチュードの違い?単純明快に!を読みました。
数値が、あまりに大きくて扱いにくいときに対数(log)を使って扱いやすくするそうです。
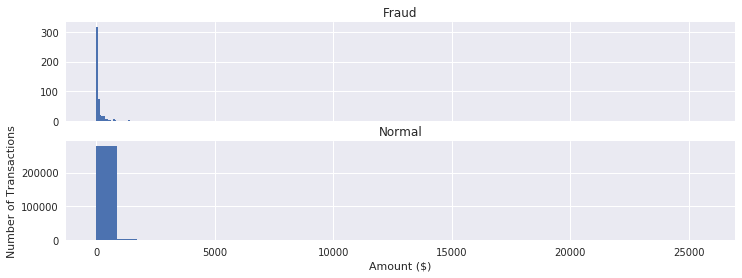
対数(log)を使わない状態
対数(log)を使わないとこのような形になります。
ヒストグラムの大半が表示されておらず、何が何だかよく分かりません。
※このソースコードはこちらを参考にしております。
import matplotlib.pyplot as plt
import pandas as pd

df = pd.read_csv("./creditcard.csv")

f, (ax1, ax2 ) = plt.subplots(2, 1, sharex=True, figsize=(12,4))

bins = 30

ax1.hist(df.Amount[df.Class == 1], bins = bins)
ax1.set_title('Fraud')

ax2.hist(df.Amount[df.Class == 0], bins = bins)
ax2.set_title('Normal')

plt.xlabel('Amount ($)')
plt.ylabel('Number of Transactions')

plt.show()
対数(log)を使った状態
対数(log)を使わないときのソースコードに対して以下を付与します。
plt.yscale('log')
import matplotlib.pyplot as plt
import pandas as pd

df = pd.read_csv("./creditcard.csv")

f, (ax1, ax2 ) = plt.subplots(2, 1, sharex=True, figsize=(12,4))

bins = 30

ax1.hist(df.Amount[df.Class == 1], bins = bins)
ax1.set_title('Fraud')

ax2.hist(df.Amount[df.Class == 0], bins = bins)
ax2.set_title('Normal')

plt.xlabel('Amount ($)')
plt.ylabel('Number of Transactions')
plt.yscale('log')
plt.show()
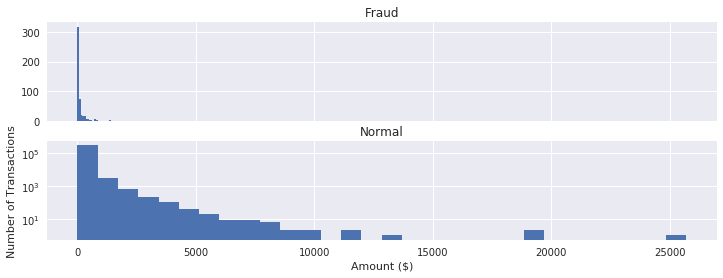
対数(log)を使わないときよりも、使っているときの方がどことなく全体の傾向が見えることが、これで分かりました。