事前準備
機械学習についての解説
ハンズオン手順
ハンズオンはPython3ベースで進みます
#0 準備
#0-1 ソースコードのダウンロード
以下のGitHubリポジトリをforkして、そこからダウンロード
icoxfog417/number_recognizer
※そのままcloneして頂いてもOKですが、forkしないと、自分で学習させた内容などを反映することができません。
#0-2 アプリケーションの動作確認
仮想環境の有効化
(以下は、事前準備通り用意してきた場合(condaで仮想環境ml_envを作成)を想定しています。変えている場合は、適宜読み替えてください)。
Windows
activate ml_env
Mac/Linux
# pyenvとのバッティングを防ぐため、activateは仮想環境のパスを確認し直接実行する
conda info -e
# conda environments:
#
ml_env                   /usr/local/pyenv/versions/miniconda3-3.4.2/envs/ml_env
root                  *  /usr/local/pyenv/versions/miniconda3-3.4.2

source /usr/local/pyenv/versions/miniconda3-3.4.2/envs/ml_env/bin/activate ml_env
動作確認
アプリケーション(localhost:3000で起動)
number_recognitionフォルダの直下で、run_application.pyを実行。
python run_application.py
機械学習モデルを構築するためのiPython notebook(localhost:8888で起動)
number_recognition/machines/number_recognizer直下で、以下を実行。
ipython notebook
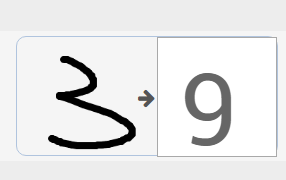
アプリケーションの方は、最初ものすごくダメな感じです。これを賢くしていきます。
#1 機械学習モデルを作成するプロセスを体験する
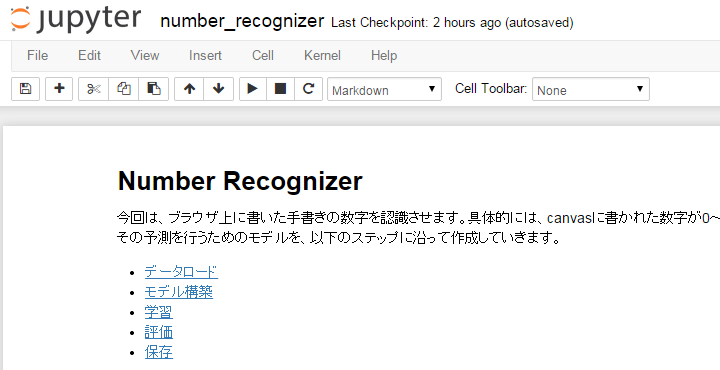
iPython notebookの方を開いてください。こちらには機械学習の各ステップを順番に書いてあります。
iPython notebookでは文中のコードが実際に実行できるため、上から順に解説&実行をしていきましょう(詳しい使い方はこちらを参照してください)。
最後の保存まで行けば、実際にモデル(number_recognition/machines/number_recognizer/machine.pkl)が更新されているはずです。
#2 学習データの分割を行う
<Handson #2 解説>
ここでは、以下2つを実施します。
- データを、学習用と評価用に分ける
- 学習データに対する精度と、評価データに対する精度をそれぞれ算出する
学習データの分割を行には、cross_validation.train_test_splitを使用します。
こちらを利用し、Training the Modelの前に、以下の処理を入れます。
def split_dataset(dataset, test_size=0.3):
    from sklearn import cross_validation
    from collections import namedtuple

    DataSet = namedtuple("DataSet", ["data", "target"])
    train_d, test_d, train_t, test_t = cross_validation.train_test_split(dataset.data, dataset.target, test_size=test_size, random_state=0)

    left = DataSet(train_d, train_t)
    right = DataSet(test_d, test_t)

    return left, right

# use 30% of data to test the model
training_set, test_set = split_dataset(digits, 0.3)
print("dataset is splited to train/test = {0} -> {1}, {2}".format(
        len(digits.data), len(training_set.data), len(test_set.data))
     )
上記でtraining_setとtest_setにデータを分割したので、Training the Modelを以下のように修正します。
classifier.fit(training_set.data, training_set.target)
これで学習は完了しました。データを分割したおかげで、評価用のデータが30%分のこっています。これを使って学習していないデータに対する精度を計測することができます。
Evaluate the Modelの精度計算部分を、以下のように修正します。
print(calculate_accuracy(classifier, training_set))
print(calculate_accuracy(classifier, test_set))
#3 モデルの評価を行う
<Handson #3 解説>
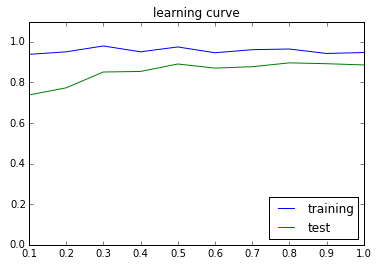
- 過学習になっていないか確認するため、学習データ・評価データそれぞれについての精度がどう変化しているかを測定します。
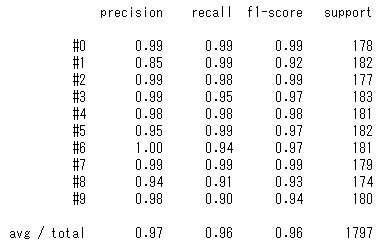
- データ不均衡による「なんちゃって精度が高いモデル」を防ぐため、適合率・再現率を確認します。
学習/評価データに対する精度の確認
以下のスクリプトで、学習/評価データに対する精度の推移を確認します。
この、横軸に学習データ数、縦軸に精度を取ったグラフを学習曲線(learning curver)と呼び、scikit-learnではsklearn.learning_curveを利用することで簡単に描画することができます。
def plot_learning_curve(model_func, dataset):
    from sklearn.learning_curve import learning_curve
    import matplotlib.pyplot as plt
    import numpy as np

    sizes = [i / 10 for i in range(1, 11)]
    train_sizes, train_scores, valid_scores = learning_curve(model_func(), dataset.data, dataset.target, train_sizes=sizes, cv=5)

    take_means = lambda s: np.mean(s, axis=1)
    plt.plot(sizes, take_means(train_scores), label="training")
    plt.plot(sizes, take_means(valid_scores), label="test")
    plt.ylim(0, 1.1)
    plt.title("learning curve")
    plt.legend(loc="lower right")
    plt.show()

plot_learning_curve(make_model, digits)
追加し終わったら、実行してみて下さい。以下のように図がプロットされるはずです。
適合率・再現率の確認
scikit-learnではclassification_report関数を使うことで、簡単に確認できます。
各ラベル(#0~#9)内で、具体的に予測したもののうちどれだけが合っていたのかなどの分析はconfusion_matrixで行うことができます。
def show_confusion_matrix(model, dataset):
    from sklearn.metrics import classification_report

    predicted = model.predict(dataset.data)
    target_names = ["#{0}".format(i) for i in range(0, 10)]

    print(classification_report(dataset.target, predicted, target_names=target_names))

show_confusion_matrix(classifier, digits)
Handson Advanced
Herokuへのデプロイ
Herokuボタンをおしてみて下さい。
conda-buildpackを利用することで、Heroku上でcondaによるアプリケーション環境構築が可能になります。
これにより、Herokuでも簡単に機械学習系アプリケーションを稼働させることができます。
詳細はこちらを参照してください
モデルのチューニング
GridSearchを利用し、モデルのパラメータを変化させながら、どのパラメータで精度が最も高くなるかを探索します。
scikit-learnでは、GridSearchCVを利用することでこの探索が可能です。
Evaluate the Modelの前に、以下のコードを入れてチューニングを行ってみて下さい。
def tuning_model(model_func, dataset):
    from sklearn.grid_search import GridSearchCV

    candidates = [
        {"loss": ["hinge", "log"],
         "alpha": [1e-5, 1e-4, 1e-3]
        }]

    searcher = GridSearchCV(model_func(), candidates, cv=5, scoring="f1_weighted")
    searcher.fit(dataset.data, dataset.target)

    for params, mean_score, scores in sorted(searcher.grid_scores_, key=lambda s: s[1], reverse=True):
        print("%0.3f (+/-%0.03f) for %r" % (mean_score, scores.std() / 2, params))

    return searcher.best_estimator_

classifier = tuning_model(make_model, digits)
オンライン機械学習
今回のアプリケーションは、予測された数値が違った場合に正しい答えを教えられるようになっています。その値は、データフォルダ内にfeedback.txtとして格納されるとともに、モデルの学習に使用されます。
こちらについても、学習させることでどう変化が生じるのか確認してみて下さい。
※注意
- ユーザーの入力ほど信頼できないものはないので、普通はこうしたスタイルで学習させることはありません。一旦データを集めて、的外れなデータを除外したのちに学習させる方が賢明です。
- 動的に学習してしまうと予期しない方向へ学習が進んでしまうことも想定されます。そのため、オンライン機械学習の採用に当たってはその設計を慎重に行う必要があります。
その他
- データセットの効果的な利用:Cross Validation
- 複数の学習機を組み合わせて精度を上げる: Ensemble Learning
- モデルの精度の評価について、より深く: Confusion Matrix
- データの整備方法について、より深く: Arrange the Data
