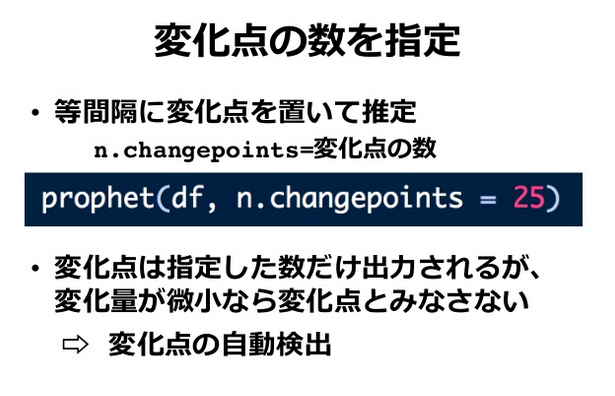
Prophet は Facebook が作った時系列予測パッケージです。詳しくは次のスライドを参照してください。
このスライドにも書きましたが、Prophet は変化点の自動検出をしてくれます。
その方法は、変化点候補を多めに取って、変化量が大きい点を変化点とするものです。
ここで注意が必要なのは、Prophet は変化点として変化点候補をすべて出力するということです。
library(prophet)

# データの読み込み
df <- read.csv("https://raw.githubusercontent.com/facebookincubator/prophet/master/examples/example_wp_peyton_manning.csv")
df$y <- log(df$y)

# 変化候補点の数を 25個として学習
m <- prophet(df, n.changepoints = 25)

# 変化点を確認
m$changepoints
 [1] "2008-03-17" "2008-06-20" "2008-10-11" "2009-01-14" "2009-04-17"
 [6] "2009-07-19" "2009-10-26" "2010-01-31" "2010-05-06" "2010-08-14"
[11] "2010-11-15" "2011-02-16" "2011-05-20" "2011-08-21" "2011-11-24"
[16] "2012-02-27" "2012-05-31" "2012-09-01" "2012-12-02" "2013-03-05"
[21] "2013-06-06" "2013-09-08" "2013-12-10" "2014-03-14" "2014-06-15"
変化点候補の数を 25個として学習させると、25個の変化点が出力されます。
しかし、各変化点での変化量を確認すると、非常に小さいものが混ざっています。
as.vector(m$params$delta)
 [1] -8.562571e-08 -3.387444e-06  3.542998e-01  4.511354e-01  6.518874e-08
 [6] -1.312443e-02 -2.305192e-01 -2.433559e-01  4.605917e-08 -3.203172e-09
[11] -1.427370e-07  2.930280e-01  1.929682e-01  4.056014e-03  1.666602e-03
[16] -7.897413e-01 -4.422746e-02 -6.516321e-08 -3.571046e-08  4.382417e-01
[21]  2.730189e-02 -2.043925e-07 -3.260183e-01 -1.118381e-09 -5.670137e-08
分かりやすくするために、小数点以下2位で丸めて表示させてみます。
round(as.vector(m$params$delta), digits = 2)
 [1]  0.00  0.00  0.35  0.45  0.00
 [6] -0.01 -0.23 -0.24  0.00  0.00
[11]  0.00  0.29  0.19  0.00  0.00
[16] -0.79 -0.04  0.00  0.00  0.44
[21]  0.03  0.00 -0.33  0.00  0.00
このように、丸めると 0 になるような点は変化点として考えたくありません。
有効な変化点の抽出
今、変化点候補の中から変化量が微小なものを除きたいとします。
しかし、Prophet にはそのような機能は備わっていません。
そこで、prophetExt というパッケージを作成し、変化点の中から変化量の大きいものだけを抜き出す関数 prophet_pick_changepoints() を作成しました。
library(prophetExt)

cpts <- prophet_pick_changepoints(m)
cpts
   changepoints  growth_rate       delta
1    2007-12-10 -0.350125769  0.00000000
2    2008-10-11  0.004170559  0.35429633
3    2009-01-14  0.455305911  0.45113535
4    2009-07-19  0.442181545 -0.01312437
5    2009-10-26  0.211662361 -0.23051918
6    2010-01-31 -0.031693514 -0.24335588
7    2011-02-16  0.261334295  0.29302781
8    2011-05-20  0.458358498  0.19702420
9    2012-02-27 -0.329716247 -0.78807475
10   2012-05-31 -0.373943805 -0.04422756
11   2013-03-05  0.064297894  0.43824170
12   2013-06-06  0.091599785  0.02730189
13   2013-12-10 -0.234418782 -0.32601857
これにより、変化量が微小なものを除いた、有効な変化点だけを抽出することができます。
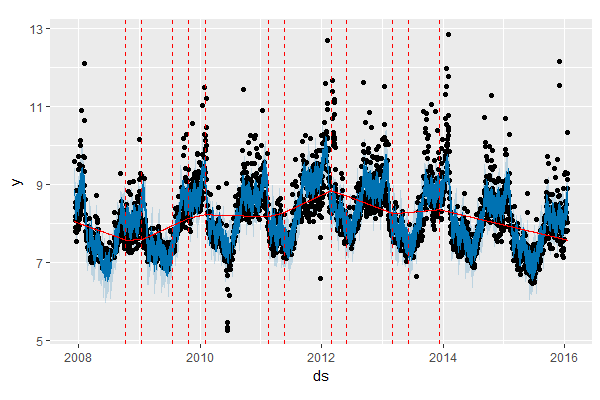
さらに、この変化点を簡単に可視化する関数 autolayer() も用意しました。
次のように使うことで Prophet の plot に重ね描きします。
future <- make_future_dataframe(m, 1)
fore <- predict(m, future)

plot(m, fore) + autolayer(cpts)
prophetExt のインストール
prophetExt パッケージは CRAN に上がっておらず、GitHub からインストールする必要があります。
GitHub のパッケージをインストールするには、githubinstall パッケージが便利です。
# githubinstall のインストール
install.packages("githubinstall")
library(githubinstall)
githubinstall("prophetExt")
Suggestion:
 - hoxo-m/prophetExt  Extension for Facebook Prophet
Do you want to install the package (Y/n)?
これを実行するとインストール候補が表示されるので、そのままエンターキーを押してください。インストールが始まります。

