本記事は ggplot2逆引き プロジェクトの一環として、Stack Overflow の下記記事を翻訳したものです。
ggplot: geom_text with dodged barplot
質問
タイトル通りのことをやりたくて、自分でやってみたのですが、ダメです。
まずはデータを用意します。
R
data <- data.frame(
  variable = gl(5, 2, labels = c("vma", "vla", "ia", "fma", "fla")),
  ustanova = gl(2, 1, 10, labels = c("srednja skola", "fakultet")),
  all = c(42.9, 38.7, 37.8, 33.7, 29.5, 26.1, 27.9, 23.9, 33.2, 26.9)
)

data
結果
   variable      ustanova  all
1       vma srednja skola 42.9
2       vma      fakultet 38.7
3       vla srednja skola 37.8
4       vla      fakultet 33.7
5        ia srednja skola 29.5
6        ia      fakultet 26.1
7       fma srednja skola 27.9
8       fma      fakultet 23.9
9       fla srednja skola 33.2
10      fla      fakultet 26.9
集合棒グラフを作り、coord_flip() で横向きにして、棒の内側にテキストを付けたいのですが、
R
library(ggplot2)
ggplot(data) +
  geom_bar(aes(x=variable, y=all, fill=ustanova), position="dodge", stat="identity") +
  geom_text(aes(x=variable, y=all, label=sprintf("%2.1f", all))) +
  coord_flip()
結果はこのようになります。
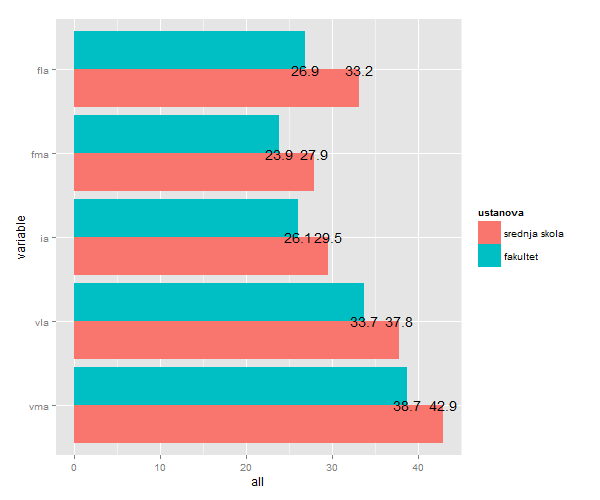
私の質問は非常に基礎的なことかもしれません。
テキストラベルが棒に「ついていく」ようにしたいのです。
ラベルは y 軸に対しては正しく配置されています。
しかし、どのようにすれば x 軸に対しても正しく配置されるのでしょうか?
回答
こういうことかな?
R
ggplot(data) +
  geom_bar(aes(x=variable, y=all, fill=ustanova), stat="identity", position="dodge") +
  geom_text(aes(x=variable, y=all, group=ustanova, label=sprintf("%2.1f", all)),
            position=position_dodge(width=0.9)) +
  coord_flip()
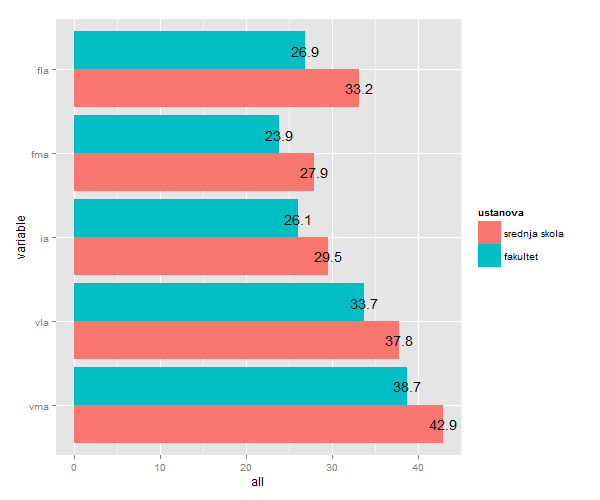
ポイントは position = "dodge" の代わりに position = position_dodge(width=0.9) を使うことと、geom_text() の中で group を指定してやることです。
position = "dodge" は position_dodge() のパラメータを指定しない単なるショートカットにすぎません。
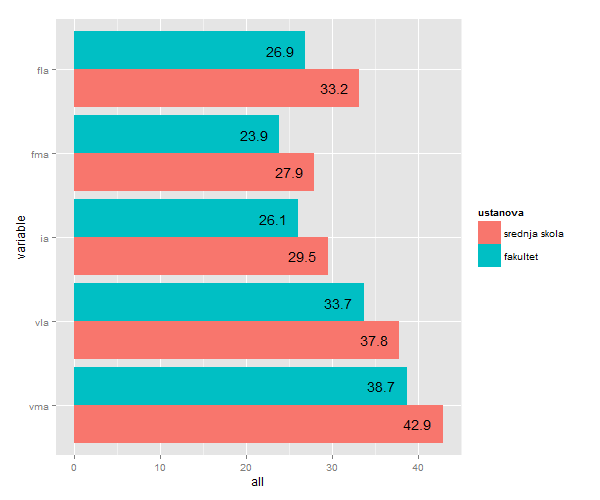
補足
テキストラベルを棒の「内側に」表示したい場合は、hjust や vjust を使います。
R
ggplot(data) +
  geom_bar(aes(x=variable, y=all, fill=ustanova), stat="identity", position="dodge") +
  geom_text(aes(x=variable, y=all, group=ustanova, label=sprintf("%2.1f", all), hjust=1.4),
            position=position_dodge(width=0.9)) +
  coord_flip()
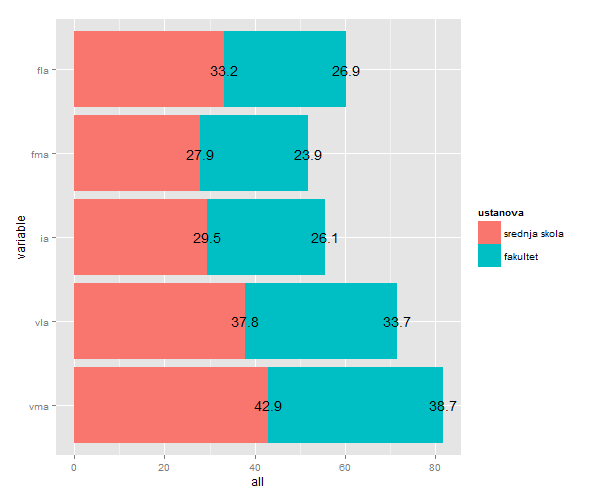
また、積み上げ棒グラフに対して同様のことを行うには、次のように書きます。
R
ggplot(data) +
  geom_bar(aes(x=variable, y=all, fill=ustanova), stat="identity", position="stack") +
  geom_text(aes(x=variable, y=all, label=sprintf("%2.1f", all)), position="stack") +
  coord_flip()