Q. ギリシャ文字や数式を表示したいです
A.
大きく分けると以下の二つの場合に分けられます。
-
expression関数を呼ぶだけでよい場合 - ggplot2が用意している、文字列を
expressionオブジェクトに変換するオプションを利用する場合
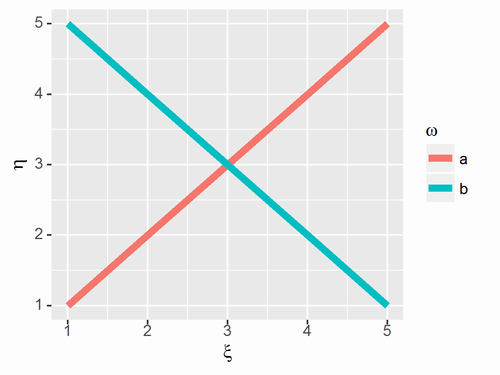
各種タイトル(title, axis.title, legend.titleなど)に表示する場合
expression関数を使います。
library(ggplot2)

d <- data.frame(X=rep(1:5, 2), Y=c(1:5, 5:1), A=rep(c('a','b'), each=5))

ggplot(data=d, aes(x=X, y=Y, group=A, color=A)) +
  geom_line(size=2) +
  labs(x=expression(xi), y=expression(eta), color=expression(omega))
なお、expression関数で使用できる記法については以下を見るとよいです。
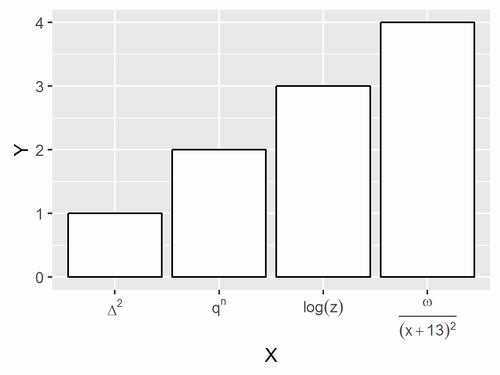
軸のラベル(axis.text)に表示する場合
expression関数を使います。
library(ggplot2)

d <- data.frame(X=tolower(LETTERS[1:4]), Y=1:4)

ggplot(d, aes(x=X, y=Y)) +
  geom_bar(colour='black',fill='white', stat='identity') +
  scale_x_discrete(breaks=c('a', 'b', 'c', 'd'),
                   labels=c(expression(Delta^2), expression(q^n), expression(log(z)), expression(over(omega,(x + 13)^2))))
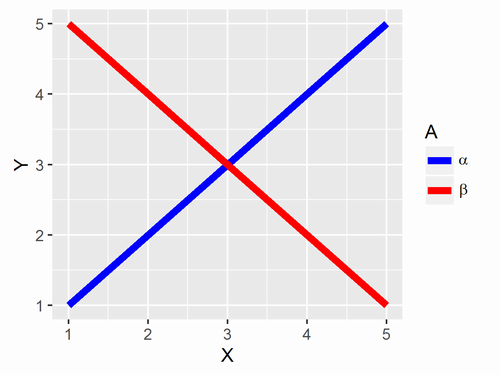
凡例のラベル(legend.text)に表示する場合
expression関数を使います。
library(ggplot2)

d <- data.frame(X=rep(1:5, 2), Y=c(1:5, 5:1), A=rep(c('alpha','beta'), each=5))

ggplot(data=d, aes(x=X, y=Y, group=A, color=A)) +
  geom_line(size=2) +
  scale_color_manual(values=c('blue', 'red'),
                     breaks=c('alpha', 'beta'),
                     labels=c(expression(alpha), expression(beta)))
変数の値を使いたい場合
例えばこの記事にあるようにexpression関数ではうまくいきません。bquote関数を使うのも便利ですが、有効数字の表示を制御するのが難しいため、僕はsprintf関数で文字列を作ってからparse関数を使ってexpressionオブジェクトにしています。
library(ggplot2)

d <- data.frame(X=rep(1:5, 2), Y=c(1:5, 5:1), A=rep(c('alpha','beta'), each=5))

val1 <- 1.0
val2 <- 2.5
mylabs <- c(parse(text=sprintf('alpha=="%.1f"', val1)), parse(text=sprintf('beta=="%.1f"', val2)))
# mylabs <- parse(text=c(sprintf('alpha=="%.1f"', val1), sprintf('beta=="%.1f"', val2)))

ggplot(data=d, aes(x=X, y=Y, group=A, color=A)) +
  geom_line(size=2) +
  scale_color_manual(values=c('blue', 'red'),
                     breaks=c('alpha', 'beta'),
                     labels=mylabs)
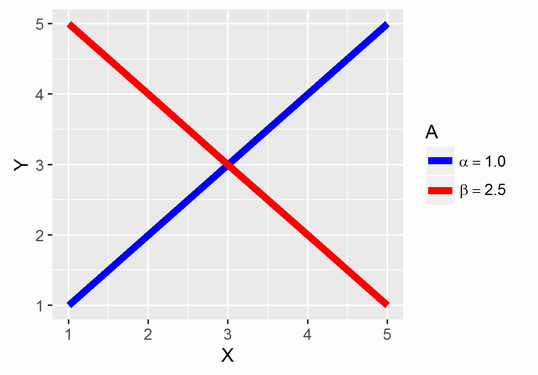
なお、7行目の代わりにコメントアウトしてある8行目を使っても同じ図を描くことができます。
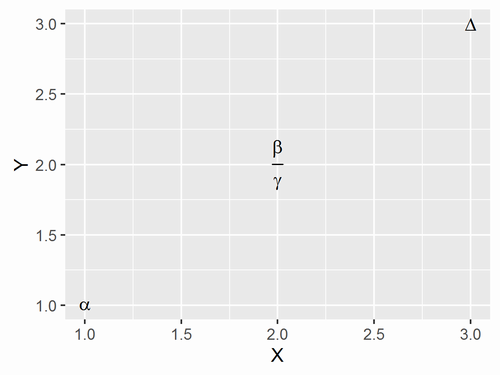
図中に表示したい
geom_text関数やannotate関数を使う際に、parse = TRUEというオプションを指定してexpressionオブジェクトに変換します。
library(ggplot2)

d <- data.frame(X=1:3, Y=1:3, Label=c('alpha', 'over(beta,gamma)','Delta'))

ggplot(data=d, aes(x=X, y=Y, label=Label)) +
  geom_text(parse=TRUE)
Facetのラベル(strip.text)に表示したい
facet_grid関数やfacet_wrap関数を使う際に、labeller = label_parsedというオプションを指定してexpressionオブジェクトに変換します。
library(ggplot2)

d <- data.frame(X=rep(1:5, 2), Y=c(1:5, 5:1), A=rep(c('alpha','beta'), each=5))

ggplot(data=d, aes(x=X, y=Y)) +
  facet_grid(. ~ A, labeller=label_parsed) +
  geom_line(size=2)
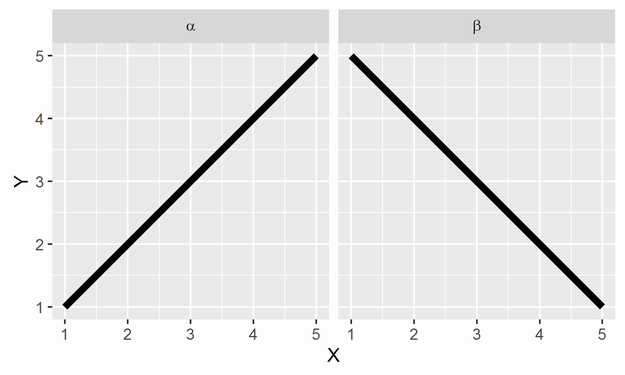
なお、facet_grid(. ~ A, labeller=label_parsed)をfacet_wrap(~ A, labeller=label_parsed)に置き換えればfacet_wrap関数でも同様に使うことができます。
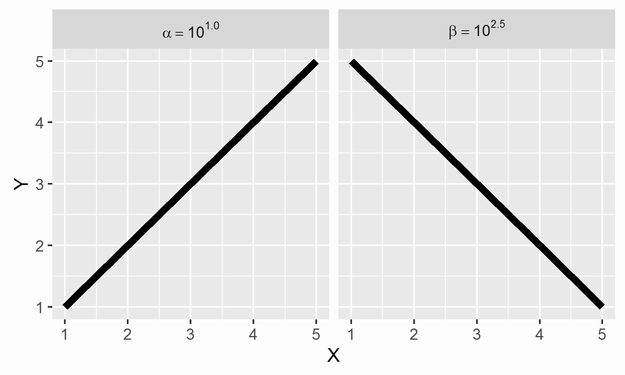
変数の値を使いたい場合
あらかじめexpressionオブジェクトに変換される文字列を作って、データフレームに入れておく方法が手間が少ないと思います。
library(ggplot2)

val1 <- 1.0
val2 <- 2.5
mylabs <- rep(c(sprintf('alpha==10^"%.1f"', val1), sprintf('beta==10^"%.1f"', val2)), each=5)
d <- data.frame(X=rep(1:5, 2), Y=c(1:5, 5:1), A=mylabs)

ggplot(data=d, aes(x=X, y=Y)) +
  facet_grid(. ~ A, labeller=label_parsed) +
  geom_line(size=2)
参考資料
http://docs.ggplot2.org/current/theme.html
https://github.com/hadley/ggplot2/wiki/Plotmath
http://stackoverflow.com/questions/5293715/how-to-use-greek-symbols-in-ggplot2
http://stackoverflow.com/questions/6202667/how-to-use-subscripts-in-ggplot2-legends-r?noredirect=1&lq=1
http://stackoverflow.com/questions/14181234/facet-labels-involving-a-greek-symbol?noredirect=1&lq=1
http://stackoverflow.com/questions/6525857/how-can-i-use-grid-to-edit-a-ggplot2-object-to-add-math-expressions-to-facet-lab?rq=1