merry Xmas!
Advent Calendar 2015も最終日になりました。
ずっとApp Engineばかりだった私ですが今年はついにCompute Engineにデビューしました!
\(^o^)/
Compute Engineのpreemptibleインスタンスを数百台instance groupで構成して自動スケールさせています。
各サーバーはTask Queueを監視して動く様になっているので、Queueの滞留サイズ監視して閾値を超えたらslackにアラート飛ばしたいなー、と思ってチャレンジしました。
Google Cloud MonitoringそのものについてはGCP Advent Calendarで他の方が既に記事を書かれてましたのでここでは割愛しますm(_ _)m
http://qiita.com/FumihikoSHIROYAMA/items/6846630b44fbc3f22b8e
注意
Google Cloud Monitoringは現時点でまだbetaです。
ここに書かれている内容は古くなる可能性が高いです。
準備
Compute Engineの自動スケールはGoogle Cloud Monitoringのメトリクスを元に行うことができるらしいので、まずはTask Queueの滞留をカスタムメトリクスとして登録してみます。
カスタムメトリクスには軽量カスタムメトリクス(Lightweight custom metrics)とラベル付きカスタムメトリクス(Labeled custom metrics)があります。
今回はラベル付きカスタムメトリクスを使用します。
まずMetricDescriptorなるものを作成します。これがメトリックの定義になります。
※軽量カスタムメトリクスの場合はこのステップを省略出来ます(メトリックを書き込むと裏で勝手に作成されるらしい)。
現時点で管理コンソールからポチポチとは作れないみたいなので、APIで作成します。
API ManagerからGoogle Cloud Monitoring APIを有効にしておきます。

↑画面で「Google cloud monitoring API」を検索して選択。

「APIを有効にする」ボタンをクリックします。
API Explorerを使ってブラウザからAPIを実行することができます。
「このAPIをAPI Exploerで試す」をクリックするとAPI Explorerが開きます。

APIの一覧が表示されるので「cloudmonitoring.metricDescriptors.create」を選択します。

右上の「Authorize requests using OAuth 2.0」のスイッチがOFFになっていたらクリック&承認してONにします。
projectフィールドにGCPのproject ID、Request bodyに登録リクエストJSONを入力します。
{
 "name": "custom.cloudmonitoring.googleapis.com/tasks_in_queue",
 "labels": [
  {
   "key": "custom.cloudmonitoring.googleapis.com/queue_name",
   "description": "A queue name."
  }
 ],
 "description": "Tasks in queue.",
 "typeDescriptor": {
  "metricType": "gauge",
  "valueType": "int64"
 },
 "project": "your_project_id"
}
APIの詳細は下記参照
https://cloud.google.com/monitoring/v2beta2/metricDescriptors#resource
nameにメトリック名、labelsでラベルを最大10個まで指定出来ます。
nameとlabelのkeyには「custom.cloudmonitoring.googleapis.com/」というプレフィックスが必要なので要注意です。
typeDescriptorのvalueTypeにはint64またはdoubleが指定出来ます。
上記ではタスク滞留を監視するメトリック「tasks_in_queue」を登録しました。
ついでに直近1分間に捌けたタスク数のメトリック「tasks_executed_min」も登録しておきます↓
{
 "name": "custom.cloudmonitoring.googleapis.com/tasks_executed_min",
 "labels": [
  {
   "key": "custom.cloudmonitoring.googleapis.com/queue_name",
   "description": "A queue name."
  }
 ],
 "description": "Tasks executed in a minute.",
 "typeDescriptor": {
  "metricType": "gauge",
  "valueType": "int64"
 },
 "project": "your_project_id"
}
メトリック収集
次にメトリックの収集ですが、Google App Engineのアプリをcronで定期起動して、そこからGoogle client libraryでcloud monitoring APIを呼び出してメトリックを書き込むことにします。
コード例はGoです。PythonやJavaなど他言語のライブラリも用意されています。
※記事の本筋からは外れるので抜粋です
func MonitorQueues(w http.ResponseWriter, r *http.Request) {
    ctx := appengine.NewContext(r)

    appID := appengine.AppID(ctx)

    queues := []string{"assemble", "flip", "order", "render"}

    qstats, err := taskqueue.QueueStats(ctx, queues)
    if err != nil {
        http.Error(w, err.Error(), http.StatusInternalServerError)
        return
    }

    hc := &http.Client{
        Transport: &oauth2.Transport{
            Source: google.AppEngineTokenSource(ctx, cloudmonitoring.MonitoringScope),
            Base:   &urlfetch.Transport{Context: ctx},
        },
    }

    service, err := cloudmonitoring.New(hc)
    if err != nil {
        http.Error(w, err.Error(), http.StatusInternalServerError)
        return
    }

    t := time.Now().UTC().Format(time.RFC3339)

    var tpoints []*cloudmonitoring.TimeseriesPoint

    newTpoint := func(metric, queue string, value int64) *cloudmonitoring.TimeseriesPoint {
        return &cloudmonitoring.TimeseriesPoint{
            Point: &cloudmonitoring.Point{
                Start:      t,
                End:        t,
                Int64Value: &value,
            },
            TimeseriesDesc: &cloudmonitoring.TimeseriesDescriptor{
                Project: appID,
                Metric:  "custom.cloudmonitoring.googleapis.com/" + metric,
                Labels: map[string]string{
                    "custom.cloudmonitoring.googleapis.com/queue_name": queue,
                },
            },
        }
    }

    for i, queue := range queues {
        tpoints = append(tpoints, newTpoint("tasks_in_queue", queue, int64(qstats[i].Tasks)))
        tpoints = append(tpoints, newTpoint("tasks_executed_min", queue, int64(qstats[i].Executed1Minute)))
    }

    req := cloudmonitoring.WriteTimeseriesRequest{Timeseries: tpoints}

    _, err = service.Timeseries.Write(appID, &req).Do()
    if err != nil {
        http.Error(w, err.Error(), http.StatusInternalServerError)
        return
    }

    return
}
queueが4種類あるのですが、それぞれの統計情報から格納されているタスク数と直近1分間の実行数を取得し、メトリックとして書き込んでいます。
ラベルqueue_nameにはそれぞれのqueue名を指定しています。
TimeseriesDescriptorのProjectフィールドと、Timeseries.Writeメソッドの第一引数にはGCPのプロジェクトIDを渡す必要があります。App Engineの場合アプリケーションID==プロジェクトIDになるのでそれを渡しています。
監視
書き込んだカスタムメトリクスをCloud Monitoringでチャートに表示しましょう。
デフォルトのダッシュボードの画面右下の方に
こんなボタンがあります。これをクリックするとチャートが追加されます。
カスタムダッシュボードを作成してそこに追加することも出来ます。

Resource Typeに「Custom Metrics V2」、Metricに作成したメトリック名、Labelsに表示したいラベルを指定します(ここでは全queueの情報を一つのチャートに表示したいのでAnyを指定)。
「Save」をクリックするとチャートが追加されます。
同様にtasks_executed_minメトリックのチャートも追加します。
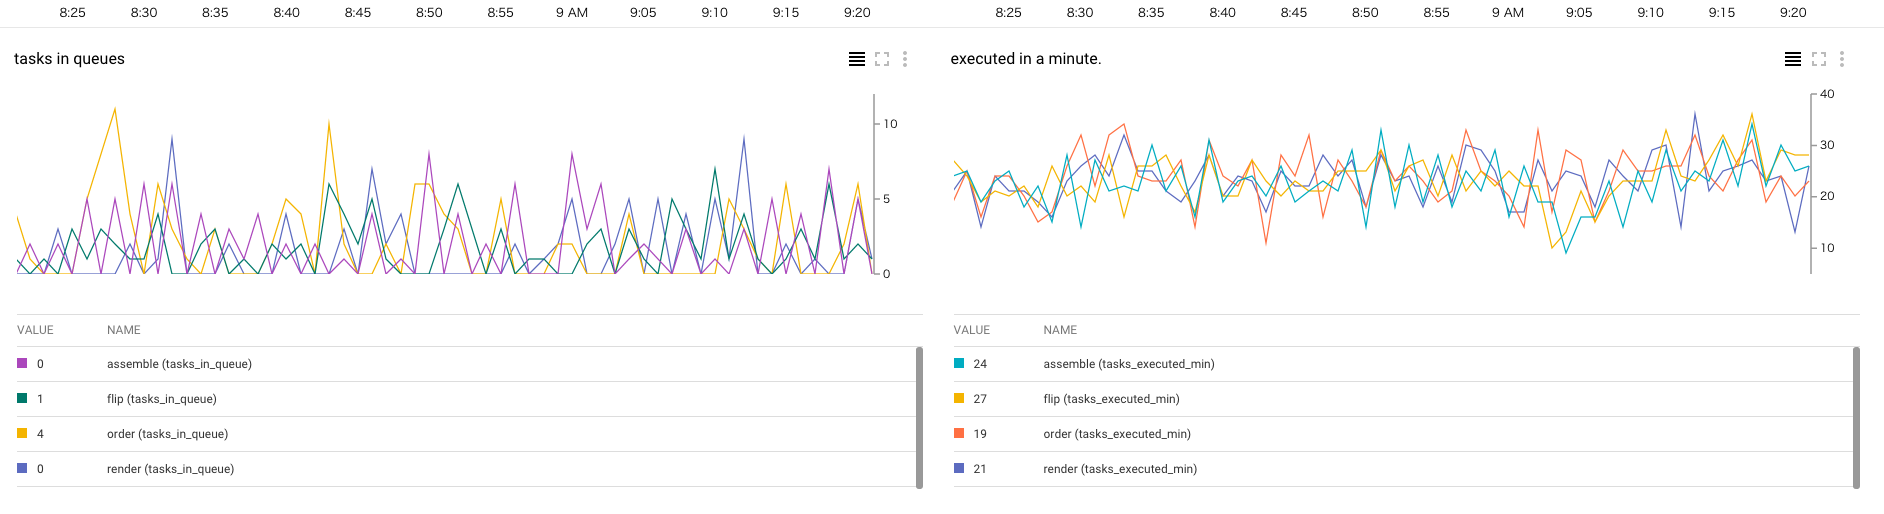
出た! \(^o^)/
便利ですね!(^^)
アラート
カスタムメトリクスを元にアラートを飛ばすことも出来ます(キューの滞留が1000を超えたらアラート、etc)。手順は通常のメトリクスに対する設定と同様です。
この辺も下記記事で既に書かれてましたので割愛しますm(_ _)m
http://qiita.com/FumihikoSHIROYAMA/items/6846630b44fbc3f22b8e
slackへのアラートも画面に従ってポチポチやっていくだけで驚くほど簡単に設定出来ました\(^o^)/
悔恨
今回実は、
「Google Cloud Monitoringを使ってTask Queueの滞留を監視して、さらにそれを指標にしてインスタンスを自動スケールさせたいズラ๑◉ﻌ◉๑」
というテーマで記事を書く予定だったのですが、仕様を少し勘違いしていて実現出来ませんでしたorz
オートスケール用メトリックはVMインスタンス単位で出力する必要があるのですね。
その辺りはまた次回の講釈で・・
良いお年を〜\(^o^)/