はじめに
先日SVG - d3.js超初心者向け ①→②を表現してみる - Qiitaを試してみました。とても勉強になりました。ありがとうございます!
これを発展させればブロック図も書けるんじゃないかと思い試してみました。
例
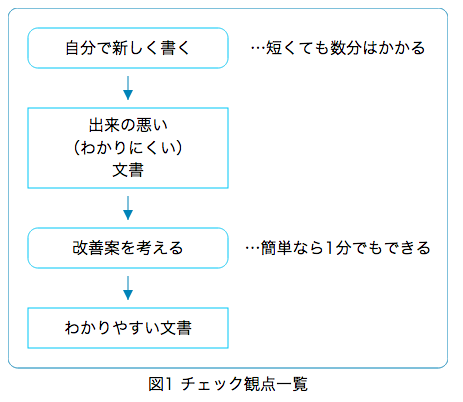
<文章嫌いではすまされない!> エンジニアのための 伝わる書き方講座:書籍案内|技術評論社のp.51の図1を書いてみました。
スクリーンショット
ソース
MITライセンスとします。
<!DOCTYPE html>
<head>
<meta charset="utf-8">
</head>
<body>
<div id='example'></div>
<script src="http://cdnjs.cloudflare.com/ajax/libs/d3/3.4.10/d3.min.js"></script>
<script>

var frameWidth = 440;
var frameHeight = 360;

var svg = d3.select("#example").append("svg")
  .attr({
    width: frameWidth,
    height: frameHeight + 30
  });

var lineHeight = 1.4;
var rects = [
  {x: 20, y:  20, w: 200, h: 40, r: 10, text: '自分で新しく書く'},
  {x: 20, y: 100, w: 200, h: 80, r:  0, text: '出来の悪い\n(わかりにくい)\n文書'},
  {x: 20, y: 220, w: 200, h: 40, r: 10, text: '改善案を考える'},
  {x: 20, y: 300, w: 200, h: 40, r:  0, text: 'わかりやすい文書'}
];

var comments = [
  {x: 230, y:  20, w: 200, h: 40, text: '…短くても数分はかかる'},
  {x: 230, y: 220, w: 200, h: 40, text: '…簡単なら1分でもできる'}
];

function midX(rect) {
  return rect.x + rect.w / 2;
}

function topY(rect) {
  return rect.y;
}

function bottomY(rect) {
  return rect.y + rect.h;
}

var connectorPadding = 8;
var connectors = [
  {
    points: [
      {x: midX(rects[0]), y: bottomY(rects[0])},
      {x: midX(rects[1]), y: topY(rects[1])}
    ]
  },
  {
    points: [
      {x: midX(rects[1]), y: bottomY(rects[1])},
      {x: midX(rects[2]), y: topY(rects[2])}
    ]
  },
  {
    points: [
      {x: midX(rects[2]), y: bottomY(rects[2])},
      {x: midX(rects[3]), y: topY(rects[3])}
    ]
  }
];

var marker = svg.append("defs").append("marker")
  .attr({
    'id': "arrowhead",
    'refX': 10 + connectorPadding,
    'refY': 5,
    'markerWidth': 10,
    'markerHeight': 10,
    'orient': "auto"
  });
marker.append("path")
  .attr({
    d: "M 0,0 V 10 L10,5 Z",
    fill: "#0083B8"
  });


svg.append('rect')
  .attr({
    'class': 'outer-frame',
    'x': 0,
    'y': 0,
    'width': frameWidth,
    'height': frameHeight,
    'rx': 10,
    'ry': 10,
    'stroke': '#0083B8',
    'stroke-width': 1,
    'fill': 'none'
  });

svg.append('text')
  .attr({
    'class': 'caption',
    'text-anchor': "middle",
    'fill': 'black',
    'dy': '1.4em',
    transform: function(d) {
      return "translate(" + frameWidth / 2 + "," + frameHeight + ")";
    },
  })
  .text('図1 チェック観点一覧');

var line = d3.svg.line()
  .interpolate("basis")
  .x(function(d) { return d.x; })
  .y(function(d) { return d.y; });

svg.selectAll('path.connector')
  .data(connectors).enter().append('path')
  .attr({
    'class': 'connector',
    'd': function(d) { return line(d.points); },
    'stroke': '#0083B8',
    'stroke-width': 1,
    'fill': 'none',
    'marker-end':"url(#arrowhead)"
  })
  .call(addPaddingToPath);

var g = svg.selectAll('g.block')
  .data(rects).enter().append('g')
  .attr({
    class: 'block',
    transform: function(d) {
      return "translate(" + d.x + "," + d.y + ")";
    },
  });

g.append('rect')
  .attr({
    'rx': function(d) { return d.r; },
    'ry': function(d) { return d.r; },
    'width': function(d) { return d.w; },
    'height': function(d) { return d.h; },
    'fill': 'none',
    'stroke': '#00C9F9',
    'stroke-width': 1
  });

g.append('text')
  .attr({
    'text-anchor': "middle",
    'fill': 'black',
    transform: function(d) {
      return "translate(" + d.w / 2 + "," + d.h / 2 + ")";
    },
  })
  .text(function(d,i) { return d.text; })
  .call(multiline, lineHeight);

svg.selectAll('text.comment')
  .data(comments).enter().append('text')
  .attr({
    'class': 'comment',
    'text-anchor': "middle",
    'fill': 'black',
    'dy': '.35em',
    transform: function(d) {
      return "translate(" + (d.x + d.w / 2) + "," + (d.y + d.h / 2) + ")";
    },
  })
  .text(function(d) { return d.text; });

function multiline(text, lineHeight) {
  text.each(function() {
    var text = d3.select(this),
        lines = text.text().split(/\n/),
        lineCount = lines.length,
        i,
        line,
        y;
    text.text('');
    for (i = 0; i < lineCount; i++) {
      line = lines[i];
      y = (i - (lineCount - 1) / 2) * lineHeight;
      text.append('tspan')
        .attr({
          'x': 0,
          'y': y ? y + 'em' : 0,
          'dy': '.35em'
        })
        .text(line);
    }
  });
}

function addPaddingToPath(path) {
  path.each(function() {
    var path = d3.select(this),
        totalLength = path.node().getTotalLength(),
        t = totalLength - 2 * connectorPadding;
    path.attr({
      'stroke-dasharray': ['0', connectorPadding, t, connectorPadding, '0'].join(' '),
      'stroke-dashoffset': '0'
    });
  });
}
</script>
</body>
</html>
メモ
1行テキストの上下方向センタリング
1行テキストの上下方向センタリングは 'dy': '.35em' で対応しています。
同じrectの用途毎にCSSクラスを付けて区別
例えば単に selectAll('path') とするとdefsの中のpathsもヒットしてしまいます。そこで、append('path') の後の attr() で class: 'connector' のようにCSSクラスを付加しておいて、selectAll('path.connector') とCSSクラスも合わせて指定するようにしてみました。
複数行テキストは自前で処理が必要
json - How to dynamically display a multiline text in D3.js? - Stack Overflowによると、d3.jsあるいはSVGで複数行のテキストを扱うには以下の3つのいずれかの対応が必要とのことです。
- 行ごとにtext要素を作成
- 1つのtext内に行ごとにtspan要素を作成
- foreignObjectを使ってHTMLを埋め込む
ただし、3番目の方式はSafariやIEでうまく表示できないというコメントがついていました。ということでここでは2番目の方式で対応しました。
ワードラップの実装は以下の2つを見つけました。
ですが、私は文字列に改行を入れてそこで折り返すようにしたかったので、これらを参考にして上記の例の multiline という関数を実装しました。
左右の配置は 'text-anchor': "middle" でセンタリングにして、transform で長方形の真ん中に配置するようにしています。左寄せや右寄せにしたい場合は text-anchor と transform を適宜調整する必要があります。
defsで定義した要素にパラメータを渡す方法は現時点では無いらしい
SVG: About using and with variable text values - Stack Overflowによると、defsで定義した要素にパラメータを渡す方法は現時点では無いようです。
コネクターの線の矢尻は 'marker-end':"url(#arrowhead)" で指定しています。色をパラメータとして渡したいところですが無理なので、複数の色の矢尻を使う場合は色ごとに別のIDでdefsに定義する必要があります。
感想
書きたい図に応じて自分でデータ構造を決めて、それに合わせてd3.jsを使った自作関数を作る方式は、融通がきいて良いなと思いました。生成されるSVGの構造も自作関数で自由自在に制御できるので、無駄に複雑な構造になってしまうこともないのも良いです。
SVGのdefsでいろいろ自作コンポーネントを定義して再利用できるとよかったんですが、パラメータを指定して利用するのが無理なので、代替策としてd3.jsを使ったユーティリティ関数を作ってライブラリ化していくのが良さそうです。SVGが力不足なところをd3.jsで補う感じですね。
SVGならepubに埋め込めますし、pdfにはSVGをPNGに変換して埋め込めばよいでしょう。あとはヘッドレスブラウザでHTML→SVG変換を行う仕組みを作れば、コマンドラインからバッチ処理で変換できて快適になりそうです。
ここ最近AsciiDoctorにPlantUMLを埋め込む方式をしばらく試していたのですが、図が複雑になるとラベルが重なってしまったりと自動配置に不満が出てきていました。一方GUIベースのドローツールは、部品のサイズや配置を揃える操作が面倒くさいと常々思っていました。この方式なら、配置が手動で面倒といえば面倒ですが、融通は利くのでトータルでは満足だと思います。
そして図をバイナリファイルではなくHTMLとJavaScriptというテキスト形式で書けるので、バージョン管理で差分を追うことも出来ます。ということで、この方式を発展させていけば、図も書きやすく管理しやすくなるのではないかと思いました。
