Fluentdを使って、複数のEC2からログを収集し、S3やElasticSearch Serviceに転送する処理を行ったので、注意事項も含めてメモします。
事前準備
S3バケットの作成
マネジメントコンソールからS3を選択し、[バケットを作成]を選択。
現れるマネジメントコンソールに例えば以下のように入力する。
バケット名: my-server-log
リージョン: Tokyo
※S3のバケット名はAWS全体で一意なので注意。各自適宜名前をつけること。
[作成]を選択
ElasticSearch Serviceのドメイン作成
マネジメントコンソールからElasticSerch Serviceを選択
[Create a new domain]を選択
Step 1: Define domain
Elasticsearch domain name: my-search-domain
Elasticsearch version: 5.1
Step 2: Configure cluster
基本はデフォルト設定のままで良い。
ここでは、
Instance type: t2.micro.elasticsearch
Storage type: EBS
に変更しておく。
[Next]を選択。
Step 3: Set up access policy
Set the domain access policy to [Select a template]
で、ここでは、Allow open access to the domainを選択。
[Next]を選択。
Step 4: Review
内容を確認したら、[Confirm and create]を選択
Fluentdのインストール
$ curl -L https://toolbelt.treasuredata.com/sh/install-redhat-td-agent2.sh | sh
ちなみに内部では以下のようなスクリプトが実行されているようです。
Treasure Dataのレポジトリをyumに追加してtd-agentをインストールしている。
echo "This script requires superuser access to install rpm packages."
echo "You will be prompted for your password by sudo."

# clear any previous sudo permission
sudo -k

# run inside sudo
sudo sh <<SCRIPT

  # add GPG key
  rpm --import https://packages.treasuredata.com/GPG-KEY-td-agent

  # add treasure data repository to yum
  cat >/etc/yum.repos.d/td.repo <<'EOF';
[treasuredata]
name=TreasureData
baseurl=http://packages.treasuredata.com/2/redhat/\$releasever/\$basearch
gpgcheck=1
gpgkey=https://packages.treasuredata.com/GPG-KEY-td-agent
EOF

  # update your sources
  yum check-update

  # install the toolbelt
  yes | yum install -y td-agent

SCRIPT
ElasticSearch Serviceに流すためのFluentdのプラグインを各サーバにインストール
$ sudo td-agent-gem install fluent-plugin-elasticsearch
※注意点としては、AggregatorとなるEC2インスタンスのセキュリティグループにTCPとUDPの両方の24224番ポートを開放しておかなければいけない。
Fluentdの設定ファイルの作成
ログを集める各サーバについて、/etc/td-agent/td-agnet.confを以下のように編集する。
<source>
  type tail
  format /^(?<host>[^ ]*) (?<remotelog>[^ ]*) (?<user>[^ ]*) \[(?<time>[^\]]*)\] "(?<method>\S+)(?: +(?<path>[^ ]*) +\S*)?" (?<status>[^ ]*) (?<size>[^ ]*) "(?<referer>[^\"]*)" "(?<agent>.*)"\ *(?<querystring>[^\"]*)$/
  time_format %d/%b/%Y:%H:%M:%S %z
  path /var/log/httpd/access_log
  tag sample.service.access.log.aggregate
  pos_file /tmp/fluent/logpos/access_log.pos
</source>

<source>
  type tail
  format /^\[(?<time>[^\]]*)\] \[(?<type>[^\]]*)\] \[(?<pid>[^\]]*)\] (\[(?<client>[^\]]*)\](?<error>.*)|(?<error>.*))$/
  time_format %a %b %d %H:%M:%S.%N %Y
  path /var/log/httpd/error_log
  tag sample.service.error.log.aggregate
  pos_file /tmp/fluent/logpos/error_log.pos
</source>

<match **>
  type forward

  <server>
    name fluent01
    host 10.0.0.31
    port 24224
  </server>
</match>
※formatは適宜サーバのログ出力に合わせて名前付きキャプチャを用いた正規表現もしくは予め用意されているものを利用して表現する。表記間違えのないように注意する。
Aggregatorとなるサーバについては、/etc/td-agent/td-agnet.confを以下のように編集する。
<source>
  type forward
  port 24224
</source>

<match sample.service.access.**>
  type copy

  <store>
    type elasticsearch
    host https://my-search-domain-xxxxxxxxxxxxxxxxxxxxx.ap-northeast-1.es.amazonaws.com
    port 443
    scheme https
    type_name access_log
    logstash_format true
    logstash_prefix micoly-service-log-access
    request_timeout 10s
    buffer_type memory
    flush_interval 60
    retry_limit 17
    retry_wait 1.0
    num_threads 1
    reload_connections false
  </store>

  <store>
    type s3
    aws_key_id AKIAXXXXXXXXXXXXXXXX
    aws_sec_key XXXXXXXXXXXXXXXXXXXXXXXXXXXXXXXXXXXXXXX
    s3_bucket my-server-log
    s3_region ap-northeast-1
    s3_object_key_format %{path}%{time_slice}/%{index}.%{hostname}.%{file_extension}
    path access-logs/
    buffer_path /tmp/fluent/s3/access/
    time_slice_format %Y%m%d-%H
    time_slice_wait 10m
    utc
    include_time_key true
  </store>
</match>

<match sample.service.error.**>
  type copy

  <store>
    type elasticsearch
    host https://my-search-domain-xxxxxxxxxxxxxxxxxxxxx.ap-northeast-1.es.amazonaws.com
    port 443
    scheme https
    type_name access_log
    logstash_format true
    logstash_prefix micoly-service-log-access
    request_timeout 10s
    buffer_type memory
    flush_interval 60
    retry_limit 17
    retry_wait 1.0
    num_threads 1
    reload_connections false
  </store>

  <store>
    type s3
    aws_key_id AKIAXXXXXXXXXXXXXXXX
    aws_sec_key XXXXXXXXXXXXXXXXXXXXXXXXXXXXXXXXXXXXXXXX
    s3_bucket my-server-log
    s3_region ap-northeast-1
    s3_object_key_format %{path}%{time_slice}/%{index}.%{hostname}.%{file_extension}
    path error-logs/
    buffer_path /tmp/fluent/s3/error
    time_slice_format %Y%m%d-%H
    time_slice_wait 10m
    utc
    include_time_key true
  </store>
</match>
※Elasticsearch ServiceではElasticsearchノードに直接アクセスできないのでreload_connections falseとしないといけない。
http://kakakakakku.hatenablog.com/entry/2016/10/29/142937
Apacheのhttpd.confログの出力の設定は以下のようになっている。
ErrorLog "logs/error_log"
LogLevel warn

<IfModule log_config_module>
    LogFormat "%h %l %u %t \"%r\" %>s %b \"%{Referer}i\" \"%{User-Agent}i\" %q" combined
    LogFormat "%h %l %u %t \"%r\" %>s %b %q" common

    <IfModule logio_module>
      LogFormat "%h %l %u %t \"%r\" %>s %b \"%{Referer}i\" \"%{User-Agent}i\" %I %O %q" combinedio
    </IfModule>
    CustomLog "logs/access_log" combined
</IfModule>
権限の設定をしておく。
```bash
$ sudo chown td-agent:td-agent /tmp/fluent/logpos/access_log.pos
$ sudo chown td-agent:td-agent /tmp/fluent/logpos/error_log.pos
$ sudo chgrp td-agent /var/log/httpd/
$ sudo chgrp td-agent /var/log/messages

$ sudo chmod g+rx /var/log/httpd/
$ sudo chmod g+rx /var/log/messages
td-agentをスタートすればログの収集が開始される。
$ sudo service td-agent start
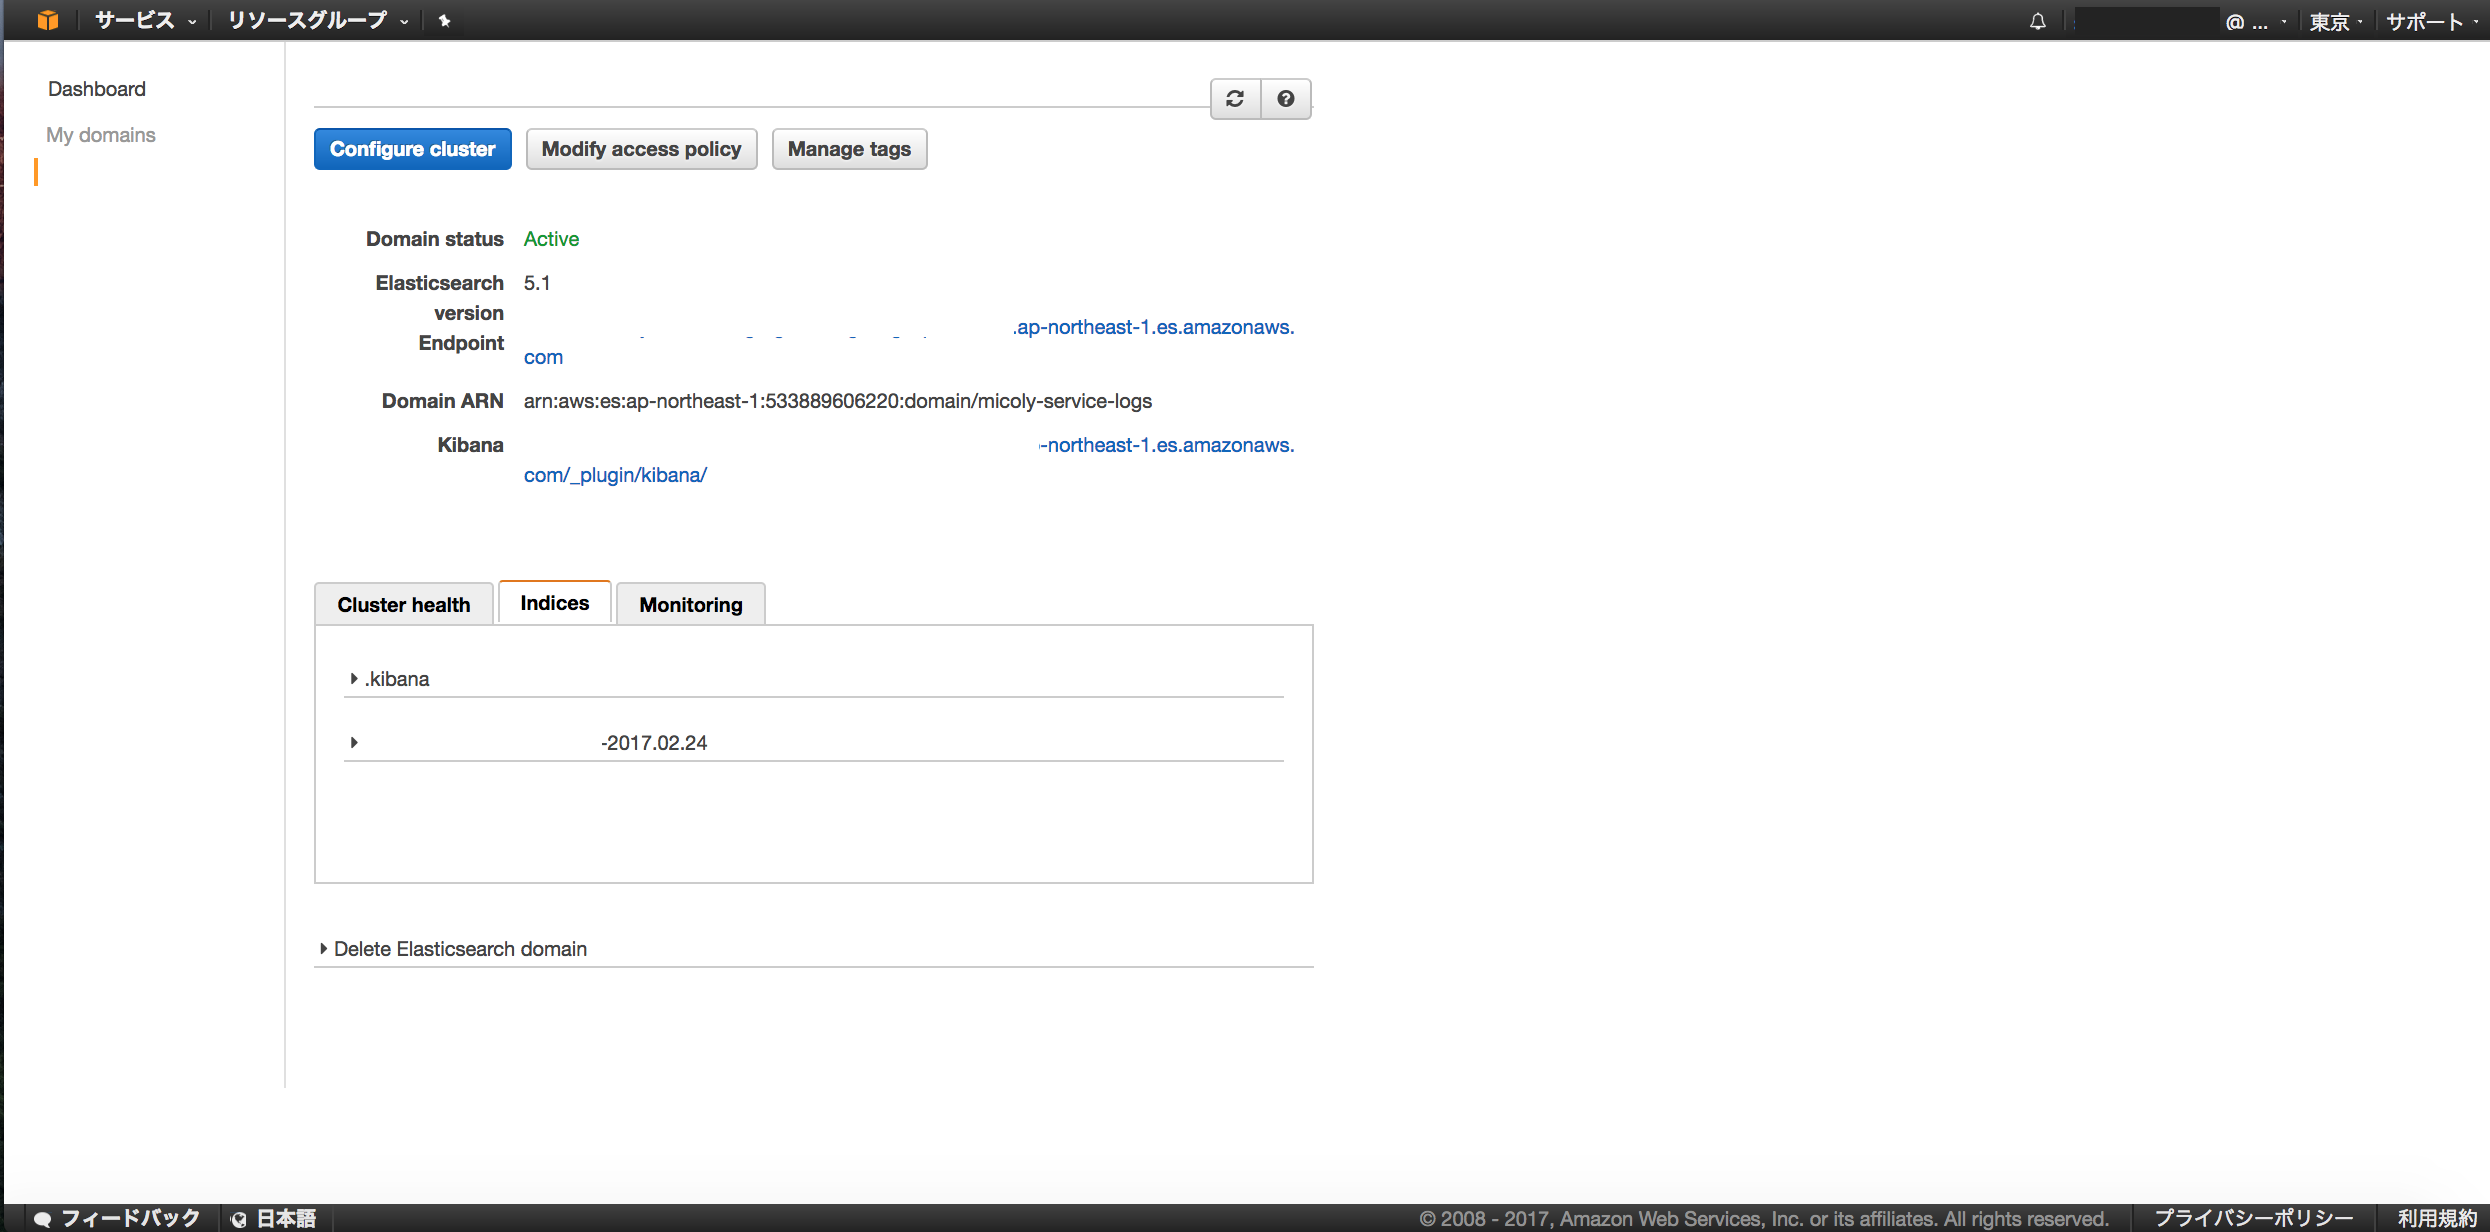
数十秒後にはElasticsearch ServiceのIndicesに各種データが更新されていることが確認できる。
Kibanaで簡単に可視化の設定もできる。

注意点 まとめ
- デバッグは
/var/log/td-agent/td-agent.logを見ながら行うなうとよい。 - formatは適宜サーバのログ出力に合わせて名前付きキャプチャを用いた正規表現もしくは予め用意されているものを利用して表現する。表記間違えのないように注意する。
- Elasticsearch ServiceではElasticsearchノードに直接アクセスできないので
reload_connections falseとしないといけない。 - fluentdではTCPとUDPの両方で設定したポート番号(ここでは24224番)を使用するので、Aggragator側のセキュリティグループのインバウンド方向を解放する設定をし忘れないようにする。
- 注意点としては、
pos_fileやbuffer_pathのような一時ファイルとして使用するファイルの権限に注意。適切な権限を付与するなどの対処を行う。 - 仕様で、タグ名部分のワイルドカードを表す記号が
*ではなく** - プラグインが入っていなくてもエラー等が出ない。直接Elasticsearchにクエリを叩くなどして原因の切り分けを明確にする。
Fluentdのログは/var/log/td-agent/td-agent.logに保存されるので、うまく動作しない場合はこのログを参照すること。
参考
http://blog.serverworks.co.jp/tech/2015/10/15/play-with-fluentd/
http://blog.serverworks.co.jp/tech/2015/10/30/play-with-amazon-es/
http://blog.serverworks.co.jp/tech/2013/06/27/fluentdtos3/
https://eure.jp/blog/fluentd_elasticsearch_kibana/
http://qiita.com/maru3/items/15db610c460ce84171e7
https://www.elastic.co/guide/en/elasticsearch/reference/1.4/indices-update-settings.html
http://blog.rdct.info/article/web/34930
http://qiita.com/khiraiwa/items/dc7e1c446d7e0c7d9482
http://ogibayashi.github.io/blog/2016/11/09/fluentd-elasticsearch-kibana/