はじめに
CloudtrailログをKibanaが使えるElasticsearchに放り込んで分析できたら便利だと思ったので、こちらを参考にLambda functionのサンプルを作ってみました。
作成した Lambda function のコードはこちら。
var aws = require('aws-sdk');
var zlib = require('zlib');
var elasticsearch = require('elasticsearch');

var ES_INDEX = 'cloudtrail'; // Elasticsearch index name
var ES_TYPE = 'log'; // Elsticsearch index type name
var ES_CLIENT = new elasticsearch.Client({
    host: '<ELASTICSEARCH_URL:PORT_NUMBER>' //Elasticsearch URL:port
});

//start lambda function
exports.handler = function(event, context) {
    console.log('Received event:');
    var bucket = event.Records[0].s3.bucket.name;
    var key = event.Records[0].s3.object.key;
    var region = event.Records[0].awsRegion;
    var s3 = new aws.S3({
        apiVersion: '2006-03-01',
        region : region
    });

    s3.getObject({
        Bucket : bucket,
        Key : key
    }, function(err,data) {
        if(err){
            context.done('error','error getting file' + err);
        } else {
            var contentType = data.ContentType;
            var contentEncoding = data.ContentEncoding;
            if (contentType === "application/json"
                && contentEncoding === "gzip") {
                var logFileName = key.substr(key.lastIndexOf("/") + 1);
                var buf = data.Body;
                zlib.gunzip(buf, function(_, dezipped) {
                    var json = JSON.parse(dezipped.toString('utf-8'));
                    sendToES(context,region,logFileName,json);
                });
            }
        }
    });
};

//bulk send to Elasticsearch
function sendToES(context,region,logFileName,json){
    var records = json.Records;
    var searchRecords = [];
    for(var i = 0; i < records.length; i++){
        var record = records[i];
        var header = {
            "index":{
                "_index": ES_INDEX,
                "_type": ES_TYPE,
                "_id": record.eventTime + "-" + record.requestID
            }
        };

        var searchRecord = {
            "usertype" : record.userIdentity.type,
            "arn" : record.userIdentity.arn,
            "accesskeyid" : record.userIdentity.accessKeyId,
            "username" : record.userIdentity.userName,
            "eventtime" : record.eventTime,
            "eventsource" : record.eventSource,
            "eventname" : record.eventName,
            "awsregion" : record.awsRegion,
            "sourceipaddress" : record.sourceIPAddress,
            "useragent" : record.userAgent,
            "requestid" : record.requestID,
            "eventid" : record.eventID,
            "logfilename" : logFileName
        };
        searchRecords.push(header);
        searchRecords.push(searchRecord);
    };
    console.log(searchRecords);
    ES_CLIENT.bulk({
        "body": searchRecords
    }, function(err, resp){
            if(err){
                console.log(err);
                context.done("error",err);
            }else{
                console.log(resp);
                context.done(null,'success');
            };
    });
};
使い方
※あらかじめCloudtrailを有効化しておいてください。Cloudtrailログが置かれるバケットはLambda functionと同一リージョンである必要があります。
まずElasticsearch / kibanaをインストールしたサーバーを用意します。kibana4が先日正式リリースになったので、今回はElasticsearch 1.4.4/kibana 4.0を選択。
Elasticsearchを起動したら、Indexを作成します。Elasticsearchはドキュメントをputすると自動でマッピングを作ってくれますが、Kibanaで使う場合はnot_analyzedを明示的に指定しておいた方が良いです。
curl -XPUT http://localhost:9200/cloudtrail -d '
{
    mappings: {
        log: {
            properties: {
                accesskeyid: {
                    type: "string",
                    index: "not_analyzed"
                },
                arn: {
                    type: "string",
                    index: "not_analyzed"
                },
                awsregion: {
                    type: "string",
                    index: "not_analyzed"
                },
                eventid: {
                    type: "string",
                    index: "not_analyzed"
                },
                eventname: {
                    type: "string",
                    index: "not_analyzed"
                },
                eventsource: {
                    type: "string",
                    index: "not_analyzed"
                },
                eventtime: {
                    type: "date",
                    format: "dateOptionalTime"
                },
                logfilename: {
                    type: "string",
                    index: "not_analyzed"
                },
                requestid: {
                    type: "string",
                    index: "not_analyzed"
                },
                sourceipaddress: {
                    type: "string",
                    index: "not_analyzed"
                },
                useragent: {
                    type: "string",
                    index: "not_analyzed"
                },
                username: {
                    type: "string",
                    index: "not_analyzed"
                },
                usertype: {
                    type: "string",
                    index: "not_analyzed"
                }
            }
        }
    }
}'
Elasticsearch環境ができたら、lambda functionを作成します。
nodeとnpmをインストールし、lambda function をパッケージする環境を整えます。Lambda開発環境の設定はこちらが参考になりました。
functionの中でElasticsearch.jsを使用するので、npmでインストールします。
npm install elasticsearch
冒頭のLambda functionをjs形式で保存し、node_moduleと一緒に zip で圧縮します。zipファイルが用意で来たらLambdaにアップロードします。
aws cli を使うと アップロードしてそのままLambda function を作成してくれます。
$ zip -r function.zip lambda-function.js node_modules

$ aws lambda upload-function --function-name CloudtrailToElasticsearch --function-zip "./function.zip" --runtime nodejs --role  arn:aws:iam::<AWS_ACCOUNT_ID>:role/lambda_exec_role --mode event --handler lambda-function.handler
Lambda Functionを作ったらイベントソースの設定をします。Lambda Management Consoleで"Configure event source"をクリックし、Cloudtrailログが出力されるs3バケットと、読み取り時に使用するIAMロールを選択してしてください。
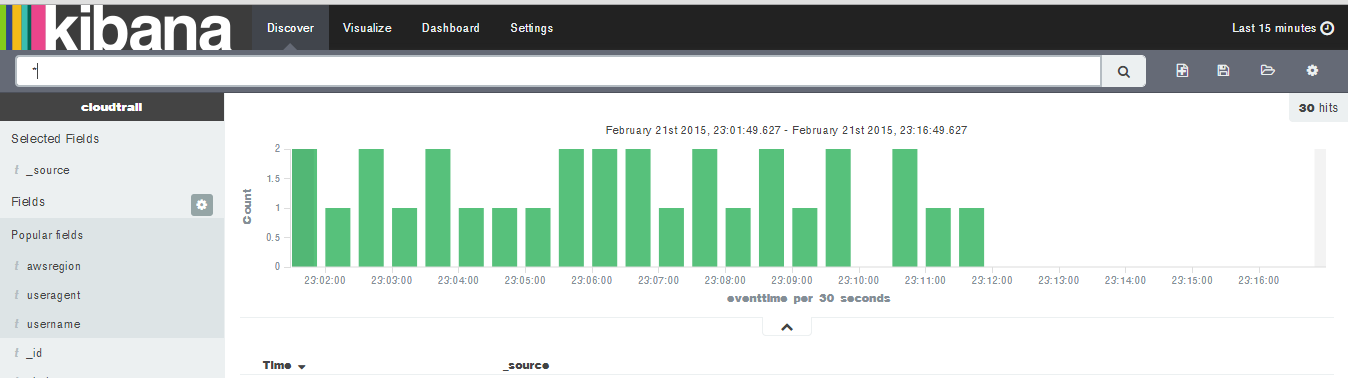
ここまで設定し、特に問題がなければCloudtrailログが自動的にElasticsearchにputされるようになります。
あとはkibana4でDashboardをつくるだけ。kibana4の操作はこちらがとても参考になりました。
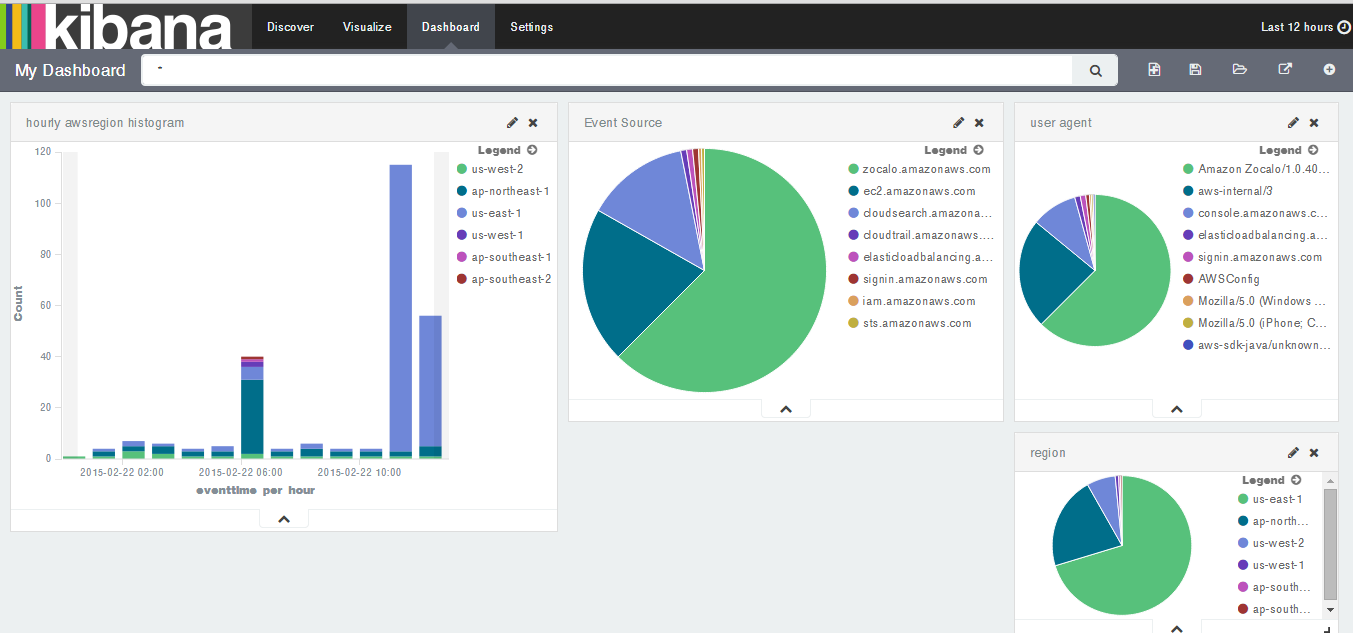
こんな感じでリージョンごとなど分析したい切り口でvisualizeを作成して、
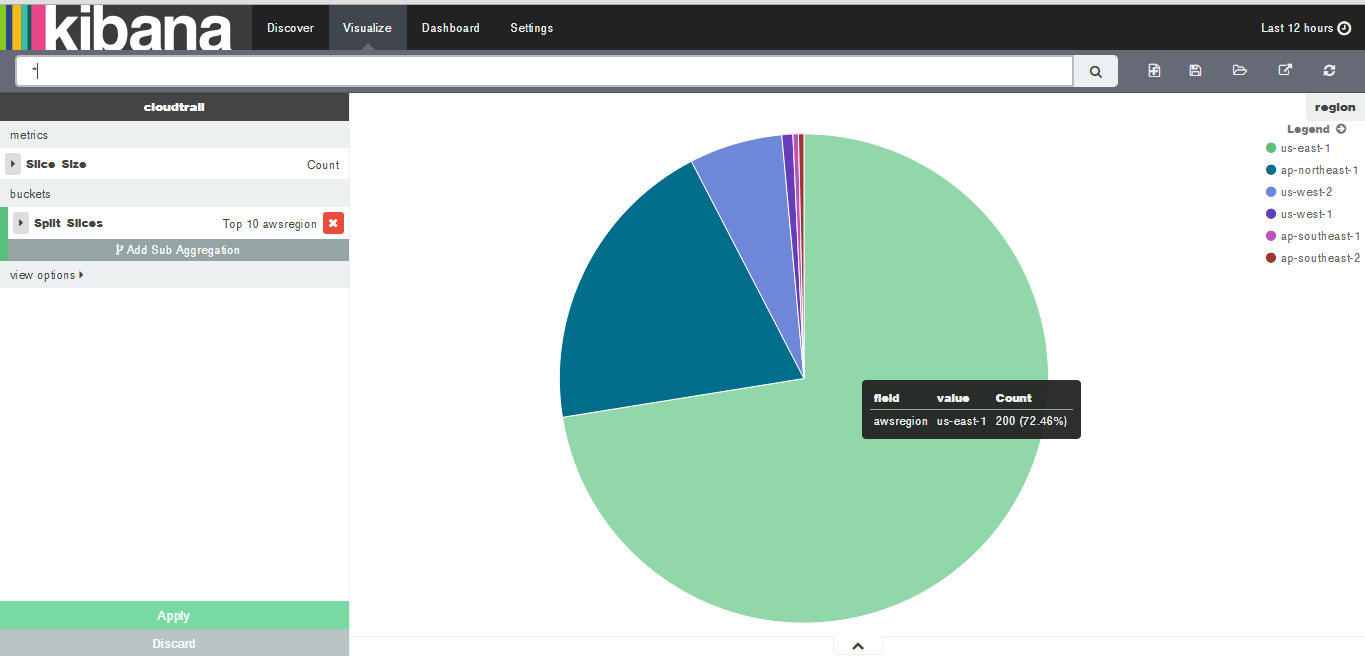
Dashboardにまとめると、あっという間にCloudtrailログの可視化ができます。