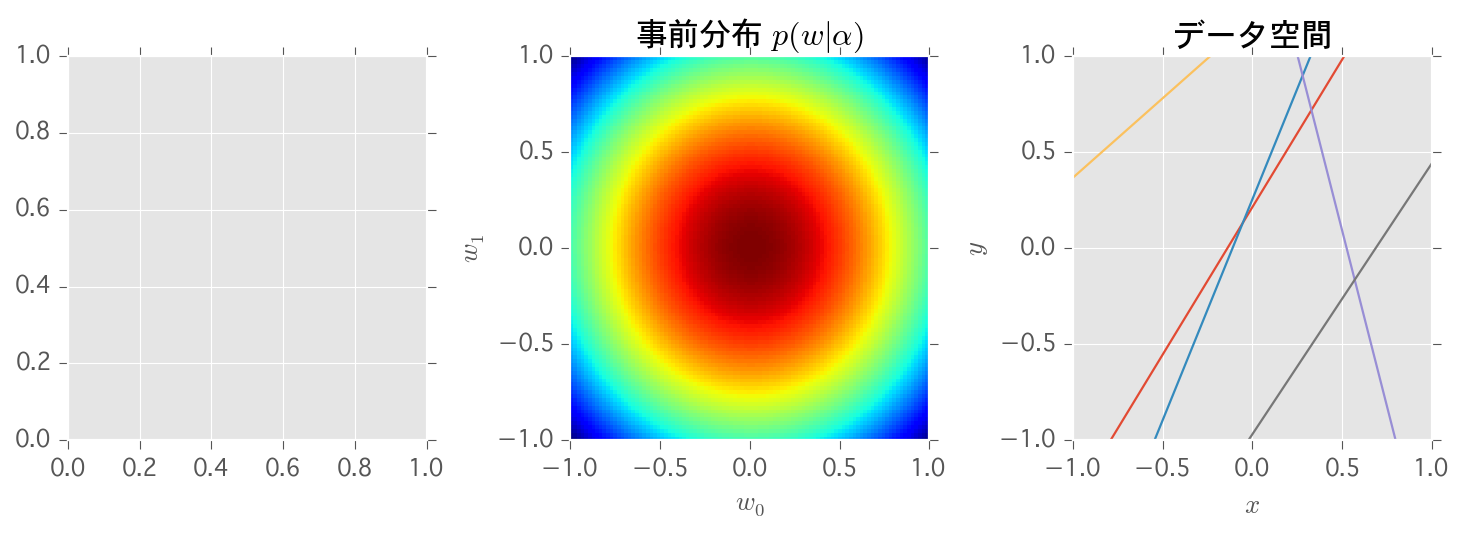
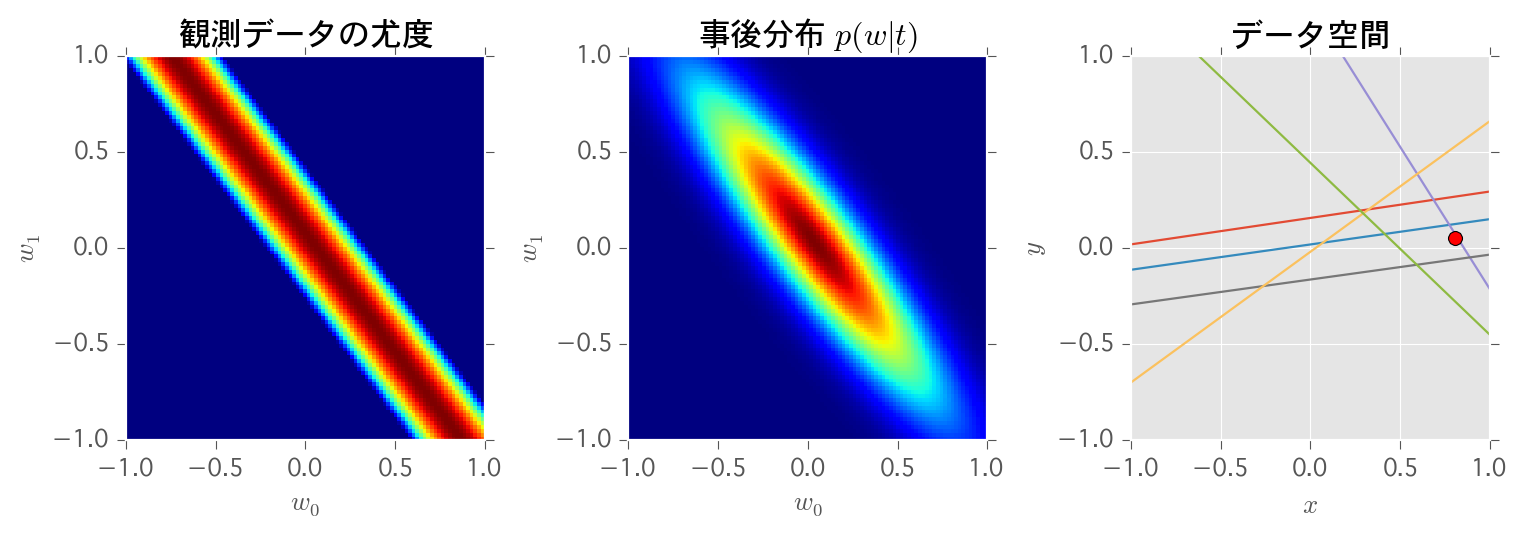
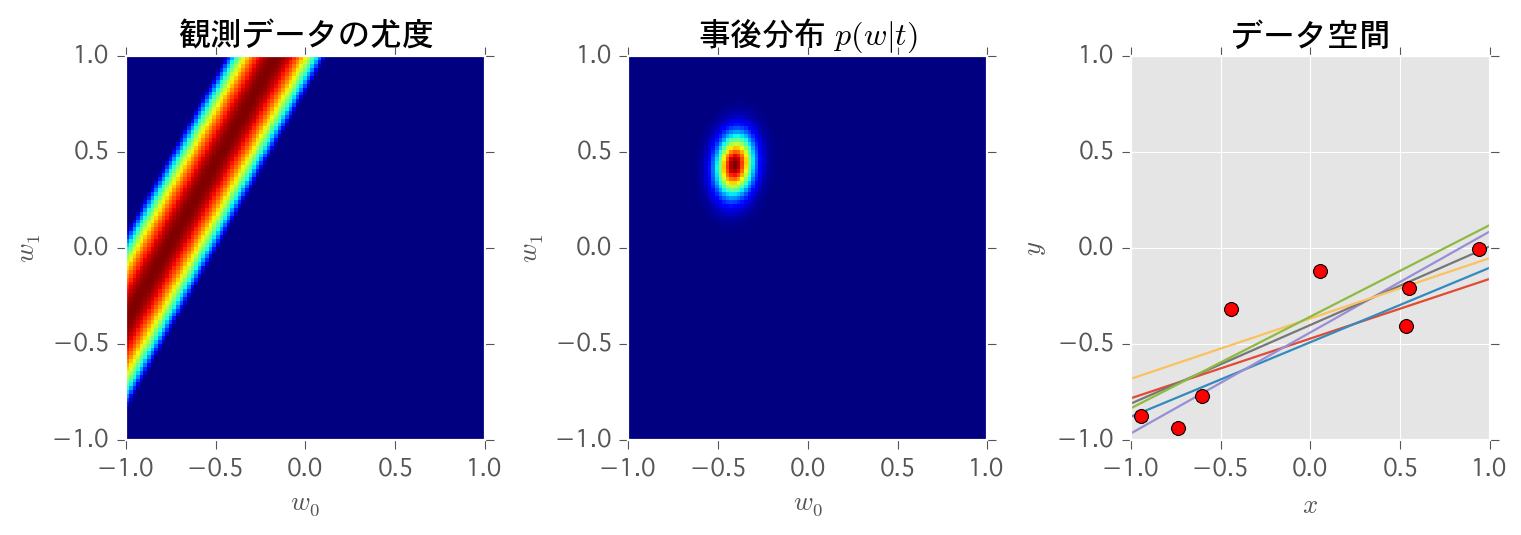
社内勉強会でぼちぼち進めているPRML、カラーの図版があると真面目に再現したくなります。今回は3.3.1のパラメータの分布の事後確率が収束する様子の図版を再現しました。この図は
- 直近の観測データ1つによるパラメータの尤度
- パラメータの事前/事後確率分布
- 事前/事後確率分布から得たパラメータによるあてはめ結果
の3つからなり、事後確率が収束していく様子が見られて面白いです。
前提
- 1次元の入力変数$x$と、1次元の目標変数$t$を考える
- $y(x, w) = w_0 + w_1x$ の線形モデルにあてはめを行なう
- モデルのパラメータ2つの分布は、2変量ガウス分布とする
- ノイズはガウスノイズとする
必要な計算部品
観測データから計画行列$\Phi$の作成
def design_matrix(x):
    return np.array([[1, xi] for xi in x])
N回データを観測した後の平均 $m_N = \beta S_N\Phi^{T}t$ を求める関数
def calc_mn(alpha, beta, x, t):
    Phi = design_matrix(x)
    Sn = calc_Sn(alpha, beta, x)
    return beta * Sn.dot(Phi.T).dot(t)
N回データを観測した後の共分散 $S_N = (\alpha I + \beta\Phi^{T}\Phi)^{-1}$ を求める関数
I = np.identity(2)

def calc_Sn(alpha, beta, x):
    Phi = design_matrix(x)
    return np.linalg.inv(alpha*I + beta*Phi.T.dot(Phi))
観測データの尤度
観測データは精度$\beta$のガウスノイズが乗る事から、対数尤度関数
logL(w) = -\frac{\beta}{2}(t-w^{T}\phi(x))^2 + cons
を利用する。対数尤度関数でプロットしたい範囲の$w$を求める。
def calc_likelifood(beta, t, x, w):
    """
    観測値1つの対数尤度を求める
    """
    w = np.array(w)
    phi_x = np.array([1, x])
    return -1 * beta / 2 * (t - w.T.dot(phi_x))**2

def plot_likelifood(beta, t, x, title='', ax=None):
    """
    観測値の尤度のプロット
    """
    w0 = np.linspace(-1, 1, 100)
    w1 = np.linspace(-1, 1, 100)
    W0,W1 = np.meshgrid(w0, w1)
    L = []
    for w0i in w0:
        L.append([calc_likelifood(beta, t, x, [w0i, w1i]) for w1i in w1])

    ax.pcolor(W0, W1, np.array(L).T, cmap=plt.cm.jet, vmax=0, vmin=-1)
    ax.set_xlabel('$w_0$')
    ax.set_ylabel('$w_1$')
    ax.set_title(title)
事後確率
上記の式で求めた $m_N$と$S_N$をパラメータとした2変量正規分布が$w$の事後確率分布となる、$m_0$と$S_0$の場合は事前確率分布。
def plot_probability(mean, cov, title='', ax=None):
    """
    確率分布(2変量ガウス)のプロット
    """
    w0 = np.linspace(-1, 1, 100)
    w1 = np.linspace(-1, 1, 100)
    W0,W1 = np.meshgrid(w0, w1)
    P = []
    for w0i in w0:
        P.append([scipy.stats.multivariate_normal.pdf([w0i,w1i], mean, cov) for w1i in w1])

    ax.pcolor(W0, W1, np.array(P).T, cmap=plt.cm.jet)
    ax.set_xlabel('$w_0$')
    ax.set_ylabel('$w_1$')
    ax.set_title(title)
データ空間
上記の式で求めた $m_N$と$S_N$をパラメータとした2変量正規分布から$w$を6回サンプリングして、プロットする。
結果
できました。全てのコードはgithubにもアップしてあります。
https://github.com/hagino3000/public-ipynb/blob/master/PRML/PRML%203.3.ipynb


