月々の電力使用量は請求書を見ればわかるけれど、「どの機器が消費しているのか」「ピーク使用量はどのくらいか」など見てみたかったのと、電力会社や料金プラン選びの参考になればってことで。
使ったもの
-
ハードウェア
-
ソフトウェア
-
参考にした記事
手順
下準備は参考記事のハードウェア準備と同じです。
ソフトウェアのインストール
Go
golang-1.7-src_1.7.1-2_armhf.deb
golang-1.7-go_1.7.1-2_armhf.deb
インストールしたら path を通しておきます。
$ export PATH=${PATH}:/usr/lib/go-1.7/bin
$ export GOROOT=/usr/lib/go-1.7
ビルドツールもインストールしておきます。
$ export GOPATH=~/.go
$ go get github.com/constabulary/gb/...
$ go get github.com/constabulary/gb/cmd/gb-vendor
InfluxDB
Grafana
grafana_3.1.1-1470786449_armhf.deb
ビルド
ソースは github で公開しています。
$ git clone https://github.com/hadanas/smartmeter.git

$ cd smartmeter

$ gb vendor restore

$ pushd vendor/src/golang.org/x/sys/unix
$ chmod +x *.sh *.pl
$ GOOS=linux GOARCH=arm ./mkall.sh
$ popd

$ gb build
インストール
$ sudo install bin/smartmeter /usr/local/bin/smartmeter
$ sudo install smartmeter.conf /etc/smartmeter.conf
設定
InfluxDB
udpセクションを以下のように編集します。
/etc/influxdb/influxdb.conf
[[udp]]
  enabled = true
  bind-address = "127.0.0.1:8089"
  database = "wattmeter"
systemd
/lib/systemd/system/smartmeter.service
[Unit]
Description=Smartmeter
After=influxdb.service

[Service]
ExecStart=/usr/local/bin/smartmeter -c /etc/smartmeter.conf
WorkingDirectory=/var/lib/smartmeter
Restart=always
Type=simple
User=smartmeter
Group=smartmeter

[Install]
WantedBy=multi-user.target
設定ファイルを書いたらsystemdに反映させます。
$ systemctl daemon-reload
smartmeter
BルートのIDとパスワードを設定します。
/etc/smartmeter.conf
[routeb]
id = "00000000000000000000000000000000"
password = "************"
起動
設定が終わったら、起動します。
# systemctl start influxdb
# systemctl start smartmeter
# systemctl start grafana-server
Grafanaにグラフを書かせるところの説明は割愛 ![]()
Watt, WattHourにそれぞれ電力、電力量の値が入っています。
$ influx
Visit https://enterprise.influxdata.com to register for updates, InfluxDB server management, and monitoring.
Connected to http://localhost:8086 version 1.0.0
InfluxDB shell version: 1.0.0
> use wattmeter
Using database wattmeter
> show measurements
name: measurements
------------------
name
Watt
WattHour

> select * from Watt limit 1
name: Watt
----------
time            watt
1472351032206787174 292

> select * from WattHour limit 1
name: WattHour
--------------
time            watthour
1472351400000000000 3074.8
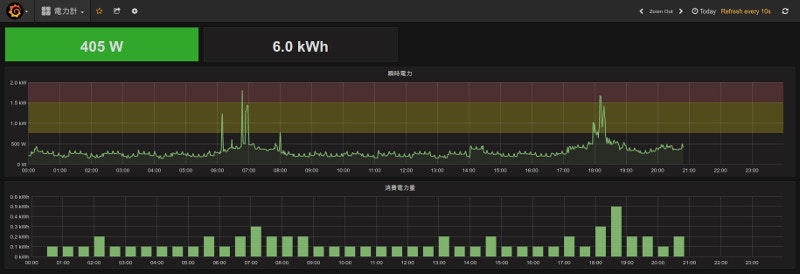
ブラウザで表示させたところ
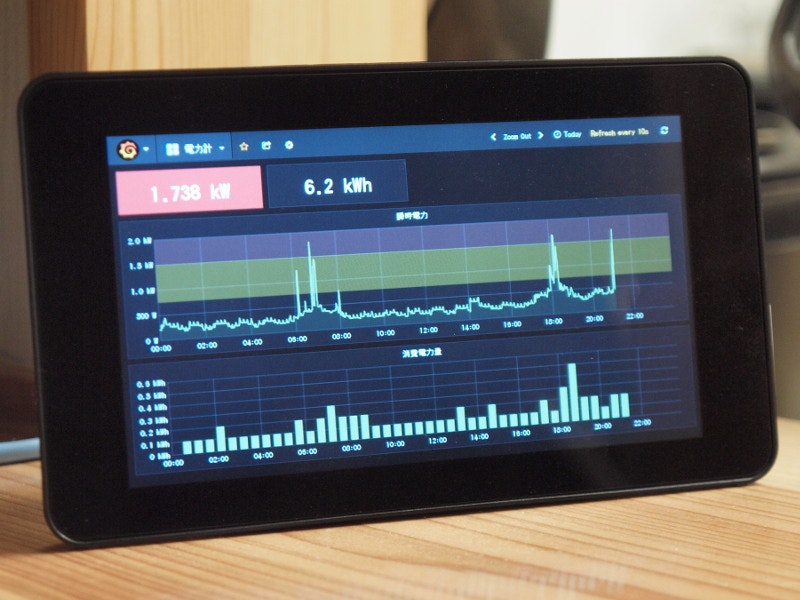
Raspberry PI だとこんな感じ。