目的
とある本に、サービスレベル指標はパーセンタイルにせよ、とあったので、まずはグラフを作るところから始めてみます
やること
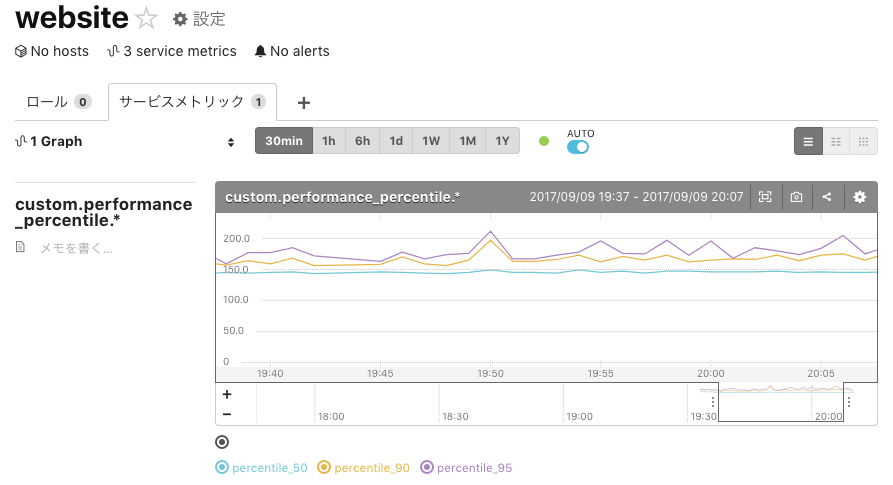
Webサーバへのリクエストのレスポンスタイムに関して、
50%はXマイクロ秒以下におさまる、
90%はYマイクロ秒以下におさまる、
95%はZマイクロ秒以下におさまる、
というX,Y,Zの値を1分ごとに計算し、グラフにします。
実質的にやることとしては以下の通りです。
- fluentdでアクセスログからパーセンタイルの値を計算
- mackerelにカスタムメトリクスを作成
環境
- EC2 AmazonLinux 2017.03 t2.micro
- apache 2.4.27
- td-agent 2.3.5
- fluent-plugin-mackerel 1.0.0
- fluent-plugin-numeric-monitor 1.0.3
fluentdの設定
fluentdのインストール
percentileプラグインとしてfluent-plugin-numeric-monitor
mackerelへの転送プラグインとしてfluent-plugin-mackerel
を利用します。
# curl -L https://toolbelt.treasuredata.com/sh/install-redhat-td-agent2.sh | sh
# /opt/td-agent/usr/sbin/td-agent-gem install fluent-plugin-numeric-monitor
# /opt/td-agent/usr/sbin/td-agent-gem install fluent-plugin-mackerel
設定ファイルの編集
# mkdir /var/fluentd
# chown td-agent:td-agent /var/fluentd
# chmod 755 /var/log/httpd/
# cat /etc/td-agent/td-agent.conf
<source>
  @type tail
  format /^(?<host>[^ ]*) [^ ]* (?<user>[^ ]*) \[(?<time>[^\]]*)\] "(?<method>\S+)(?: +(?<path>[^ ]*) +\S*)?" (?<code>[^ ]*) (?<size>[^ ]*)(?: "(?<referer>[^\"]*)" "(?<agent>[^\"]*)")? (?<duration>[0-9]+)$/
  time_format %d/%b/%Y:%H:%M:%S %z
  path /var/log/httpd/access_log
  tag localhost.access
  pos_file /var/fluentd/access.pos
</source>

<match localhost.access>
  @type numeric_monitor

  tag monitor.duration

  unit minute

  aggregate all
  monitor_key duration
  percentiles 50,90,95
</match>

<match monitor.duration>
  @type mackerel
  api_key XXXXXXXXXXXXXXXXXXX
  service website
  metrics_name performance_percentile.${out_key}
  use_zero_for_empty
  out_keys percentile_50,percentile_90,percentile_95
</match>
# /etc/init.d/td-agent start
動作確認
# yum install httpd24
# vim /etc/httpd/conf/httpd.conf
LogFormat "%h %l %u %t \"%r\" %>s %b \"%{Referer}i\" \"%{User-Agent}i\" %D" combined
# cat /var/www/html/index.html
hogehoge
# watch -n 1 "curl -s http://localhost/ > /dev/null"
...1時間くらい待つ
まとめ
fluentdを介せば意外と簡単にグラフに出来そうでした。
もっと手軽にやるならCloudWatchで十分だと思います。
ステータスコードが200のログのみに絞らないと、速くなったと思ったらエラーが増加してました、とかなりそうです。
単位をミリ秒に直したいです。