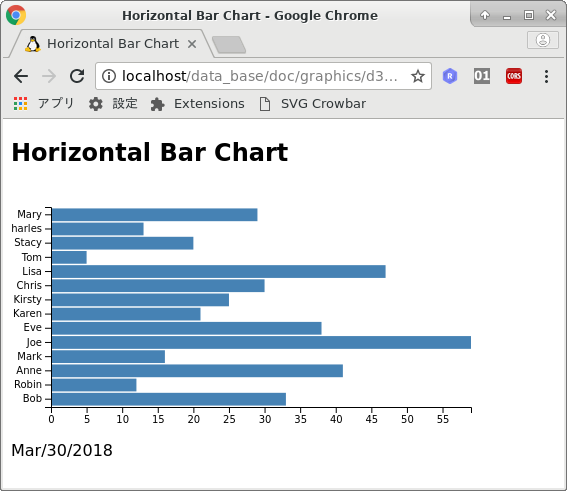
d3.js の Version 5.0.0 のサンプルです。
<!DOCTYPE html>
<html lang="ja">
<head>
<meta http-equiv="Pragma" content="no-cache" />
<meta http-equiv="Cache-Control" content="no-cache" />
<meta http-equiv="CONTENT-TYPE" content="text/html; charset=utf-8" />
<script src="/js/jquery-3.4.1.min.js"></script>
<script src="/js/d3.v5.min.js"></script>
<link href="horizontal_bar_chart.css" rel="stylesheet">
<title>Horizontal Bar Chart</title>
</head>
<body>
<h2>Horizontal Bar Chart</h2>
<div id="Dash"></div>
<script src="horizontal_bar_chart.js"></script>
Mar/30/2018<p />
</body>
horizontal_bar_chart.css
/* ------------------------------------------------------------------- */
/*
    horizontal_bar_chart.css

                        Jun/02/2017
*/
/* ------------------------------------------------------------------- */
.bar { fill: steelblue; }
/* ------------------------------------------------------------------- */
horizontal_bar_chart.js
// ------------------------------------------------------------------
//  horizontal_bar_chart.js
//
//                      Jun/02/2017
//
// ------------------------------------------------------------------
const file_json="data.json"

jQuery.getJSON(file_json,function (data)
    {
    horizontal_bar_chart_proc(data)
    })

// ------------------------------------------------------------------
function horizontal_bar_chart_proc (data)
{
// set the dimensions and margins of the graph
const margin = {top: 20, right: 20, bottom: 30, left: 40}
const width = 480 - margin.left - margin.right
const height = 250 - margin.top - margin.bottom

// set the ranges
const y = d3.scaleBand()
          .range([height, 0])
          .padding(0.1);

const x = d3.scaleLinear()
          .range([0, width]);

// append the svg object to the body of the page
// append a 'group' element to 'svg'
// moves the 'group' element to the top left margin
var svg = d3.select("#Dash").append("svg")
    .attr("width", width + margin.left + margin.right)
    .attr("height", height + margin.top + margin.bottom)
  .append("g")
    .attr("transform",
          "translate(" + margin.left + "," + margin.top + ")");

  // format the data
  data.forEach(function(d) {
    d.sales = +d.sales;
  });

  // Scale the range of the data in the domains
  x.domain([0, d3.max(data, function(d){ return d.sales; })])
  y.domain(data.map(function(d) { return d.salesperson; }));
  //y.domain([0, d3.max(data, function(d) { return d.sales; })]);

  // append the rectangles for the bar chart
  svg.selectAll(".bar")
      .data(data)
    .enter().append("rect")
      .attr("class", "bar")
      //.attr("x", function(d) { return x(d.sales); })
      .attr("width", function(d) {return x(d.sales); } )
      .attr("y", function(d) { return y(d.salesperson); })
      .attr("height", y.bandwidth());

  // add the x Axis
  svg.append("g")
      .attr("transform", "translate(0," + height + ")")
      .call(d3.axisBottom(x));

  // add the y Axis
  svg.append("g")
      .call(d3.axisLeft(y));
}

// ------------------------------------------------------------------
data.json
[
  {
    "salesperson": "Bob",
    "sales": 33
  },
  {
    "salesperson": "Robin",
    "sales": 12
  },
  {
    "salesperson": "Anne",
    "sales": 41
  },
  {
    "salesperson": "Mark",
    "sales": 16
  },
  {
    "salesperson": "Joe",
    "sales": 59
  },
  {
    "salesperson": "Eve",
    "sales": 38
  },
  {
    "salesperson": "Karen",
    "sales": 21
  },
  {
    "salesperson": "Kirsty",
    "sales": 25
  },
  {
    "salesperson": "Chris",
    "sales": 30
  },
  {
    "salesperson": "Lisa",
    "sales": 47
  },
  {
    "salesperson": "Tom",
    "sales": 5
  },
  {
    "salesperson": "Stacy",
    "sales": 20
  },
  {
    "salesperson": "Charles",
    "sales": 13
  },
  {
    "salesperson": "Mary",
    "sales": 29
  }
]