index.html
<!DOCTYPE html>
<html lang="ja">
<head>
<meta charset="utf-8">
<title>Chart.js 折れ線グラフ</title>
<script src="https://cdnjs.cloudflare.com/ajax/libs/Chart.js/3.9.1/chart.min.js"></script>
<script src="line_graph.js"></script>
</head>
<body>
<h1>Chart.js 折れ線グラフ</h1>
<canvas id="chart" height="200" width="400"></canvas>
<hr />
Dec/09/2021<p />
</body>
</html>
line_graph.js
// ----------------------------------------------------------------------
// line_graph.js
//
// Aug/07/2023
// ----------------------------------------------------------------------
window.onload = ()=>
{
const config = {
type: 'line',
data: barChartData
}
const context = document.getElementById("chart")
const chart = new Chart(context,config)
}
// ----------------------------------------------------------------------
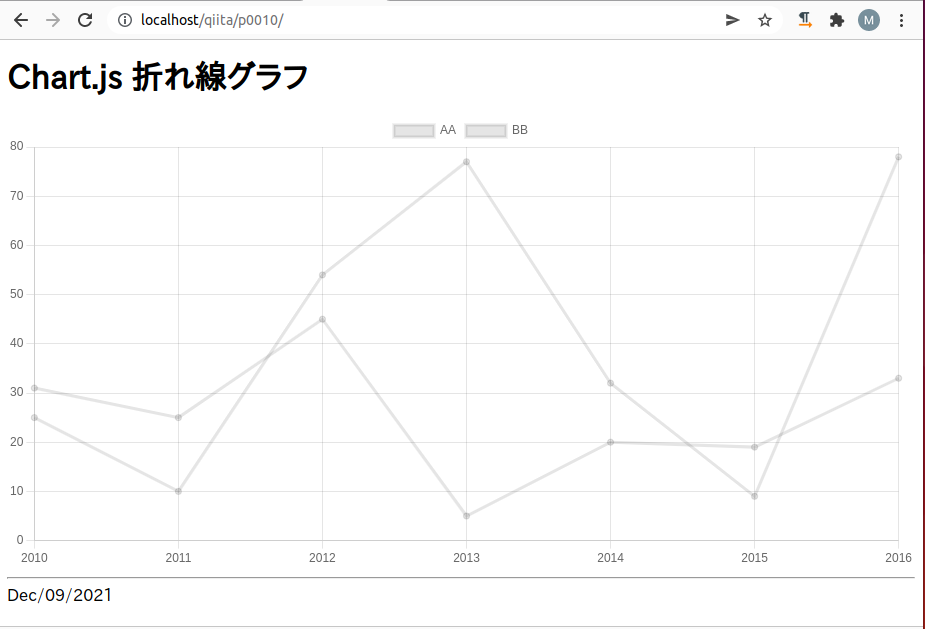
const barChartData = {
labels : ["2010","2011","2012","2013","2014","2015","2016"],
datasets : [
{
label: "AA",
lineTension: 0,
data : [31,25,45,5,20,19,33]
},
{
label: "BB",
lineTension: 0,
data : [25,10,54,77,32,9,78]
}
]
}
// ----------------------------------------------------------------------
次のバージョンで確認しました。
Chart.js v3.9.1