index.html
<!DOCTYPE html>
<html lang="ja">
<head>
<meta charset="utf-8">
<title>Chart.js 棒グラフ</title>
<script src="https://cdnjs.cloudflare.com/ajax/libs/Chart.js/3.9.1/chart.min.js"></script>
<script src="bar_graph.js"></script>
</head>
<body>
<h1>Chart.js 棒グラフ</h1>
<canvas id="chart" height="200" width="400"></canvas>
<hr />
Dec/09/2021<p />
</body>
</html>
bar_graph.js
// ----------------------------------------------------------------------
// bar_graph.js
//
// Aug/07/2023
// ----------------------------------------------------------------------
window.onload = ()=>
{
const config = {
type: 'bar',
data: barChartData,
responsive : true
}
const context = document.getElementById("chart")
const chart = new Chart(context,config)
}
// ----------------------------------------------------------------------
const barChartData = {
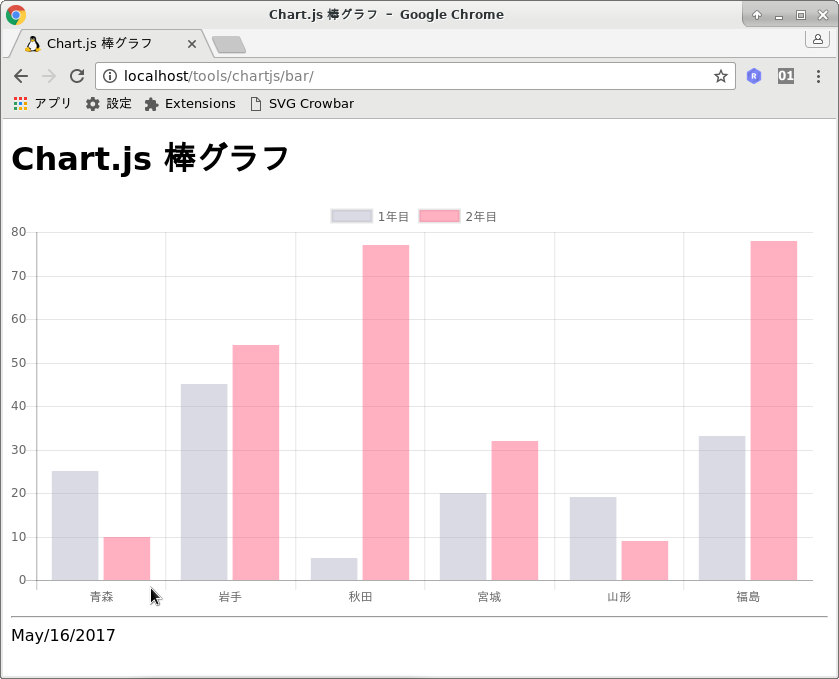
labels : ["青森","岩手","秋田","宮城","山形","福島"],
datasets : [
{
label: "1年目",
backgroundColor: "rgba(179,181,198,0.5)",
data : [25,45,5,20,19,33]
},
{
label: "2年目",
backgroundColor: "rgba(255,99,132,0.5)",
data : [10,54,77,32,9,78]
}
]
}
// ----------------------------------------------------------------------