初めてWatson IoT Platformを使ってみよう、というかたのためのガイドです。
Watson IoT Platformを使ってみるでIoTアプリを準備しました。
IoTダッシュボードを作ってみるでIoTデータを可視化するダッシュボードを作っていきます。
ダッシュボードの一部をスマホ向けに出します
- 下記のフローをコピペします
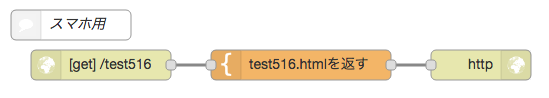
ダッシュボードの一部をスマホ向けに
[{"id":"76911cf7.2b701c","type":"http in","z":"d1ef1dbb.433ae","name":"","url":"/test516","method":"get","swaggerDoc":"","x":130,"y":1140,"wires":[["c2026b5f.8183b8"]]},{"id":"c2026b5f.8183b8","type":"template","z":"d1ef1dbb.433ae","name":"test516.htmlを返す","field":"payload","fieldType":"msg","format":"handlebars","syntax":"mustache","template":"<head>\n <meta charset=\"utf-8\" />\n <meta name=\"viewport\" content=\"width=device-width, initial-scale=1\" />\n <title>センサーからのIoT値をリアルタイムで表示</title>\n <link rel=\"stylesheet\" href=\"http://code.jquery.com/mobile/1.4.2/jquery.mobile-1.4.2.min.css\" />\n <script src=\"http://code.jquery.com/jquery-1.11.0.min.js\"></script>\n <script src=\"http://code.jquery.com/mobile/1.4.2/jquery.mobile-1.4.2.min.js\"></script>\n <script type=\"text/javascript\" src=\"https://www.google.com/jsapi\"></script>\n <script type=\"test/javascript\" src=\"https://www.gstatic.com/charts/loader.js\"></script>\n</head>\n\n<body>\n <h2 style=\"margin-left:10px;\">照度</h2>\n <span style=\"text-align:left; font-size:18pt; margin-left:100px;\" id=\"e1data\"></span>lux\n <div id=d1 align=\"center\">\n </div>\n <div id=f1>\n </div>\n <div data-role=\"footer\">\n <h3>copyright (c) abc.com All rights reserved.</h3>\n </div>\n\n<script>\n //var c2alert0 = 0, c2alert1 = 0, c2alert2 = 0, c2alert3 = 0, c2alert4 = 0, c2alert5 = 0, c2alert6 = 0;\n var connection = new WebSocket('wss://このIoTアプリの名前.mybluemix.net/wss/flow516');\n\n connection.onopen = function () {\n console.log(\"websocket connected\");\n };\n\n // Log errors\n connection.onerror = function (error) {\n console.log('WebSocket Error ' + error);\n };\n\n // Log messages from the server\n connection.onmessage = function (m) {\n //console.log('Server: ' + m.data);\n \tdoIt(m);\n };\n\n google.load('visualization', '1', {packages:['gauge', 'corechart']});\n google.setOnLoadCallback(drawChart);\n\n // 温度ゲージをlow1に、湿度ゲージをlow2に表示する\n function drawChart() {\n \td1GaugeData = google.visualization.arrayToDataTable([\n \t\t['Label', 'Value'],\n \t\t['照度', 0]\n \t]);\n d1GaugeOptions = {\n \t\twidth: 500, height: 150,\n \t\tmin: 0, max: 500,\n \t\tyellowFrom:300, yellowTo: 400,\n redFrom: 400, redTo: 500,\n \t\tminorTicks: 5\n \t};\n d1Gauge = new google.visualization.Gauge(document.getElementById('d1'));\n \td1Gauge.draw(d1GaugeData, d1GaugeOptions);\n\n f1ChartData = google.visualization.arrayToDataTable(\n [[\"時刻\",\"照度\"],['10:00:00',300]] );\n f1ChartData.removeRow(0);\n f1ChartOptions = { title: '照度',\n legend: { position: 'bottom' },\n backgroundColor: {stroke:'#c1d8ac' ,strokeWidth:10, fill:'#ffffff'}\n };\n f1Chart = new google.visualization.LineChart(document.getElementById('f1'));\n f1Chart.draw(f1ChartData, f1ChartOptions);\n\n\n };\n\n //websocketからの毎秒のデータを受信してゲージ・チャートへ表示する\n function doIt(msg){\n console.log(\"doit:\" + msg.data);\n \tvar msgs = JSON.parse(msg.data);\n\n d1GaugeData = google.visualization.arrayToDataTable([\n ['Label', 'Value'],\n ['照度', msgs[4][0]]\n ]);\n d1Gauge.draw(d1GaugeData, d1GaugeOptions);\n console.log(\"msgs[4][0] = \" + msgs[4][0]);\n f1ChartData.addRow( [ msgs[0][0], msgs[4][0] ] );\n if ( f1ChartData.getNumberOfRows() > 9) {\n f1ChartData.removeRow(0);\n }\n f1Chart.draw(f1ChartData, f1ChartOptions);\n\n target = document.getElementById(\"e1data\"); // 照度 e1に表示\n \ttarget.innerHTML = msgs[4];\n\n\n };\n</script>\n</body>\n","x":330,"y":1140,"wires":[["c7979077.681e38"]]},{"id":"c7979077.681e38","type":"http response","z":"d1ef1dbb.433ae","name":"","x":510,"y":1140,"wires":[]},{"id":"b6508dd5.c3e59","type":"comment","z":"d1ef1dbb.433ae","name":"スマホ用","info":"","x":100,"y":1100,"wires":[]}]
-
「test516.htmlを返す」テンプレートノードの25行目の
var connection = new WebSocket('wss://このIoTアプリの名前.mybluemix.net/wss/flow516');をアプリ名に合わせて変更します -
WebSocketの出力に合わせ、スマホでゲージ/チャートが出力される事を確認します
