もう何度挫折したか分かりませんが、懲りずにRに再挑戦。
こういう関数があって、
# 二次元正規分布の密度関数
multivariate_normal_distribution_2 <- function(x, mu, Sigma) {
  return ((1/2/pi) / sqrt(det(Sigma)) * exp(-1/2 * t(x - mu) %*% solve(Sigma) %*% (x - mu)))
}

# パラメータ
alpha <- 2.0
mu <- c(0,0)
Sigma <- rbind(
  c(alpha, 0),
  c(0, alpha)
)
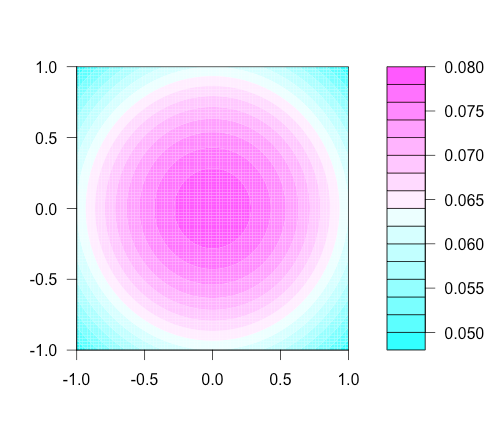
density mapをプロットしたい。
定義域を決めて、
M <- 100
w0 <- seq(-1,1,length=M)
w1 <- seq(-1,1,length=M)
この範囲で値を求めておいて、
density <- matrix(1:(M*M), nrow=M)
for (i in 1:M) {
  for (j in 1:M) {
    density[j,i] <- multivariate_normal_distribution_2( c(w0[i], w1[j]), mu, Sigma )
  }
}
filled.contourを使えば良いらしい。
filled.contour(w0, w1, density)
ベクトル化
二重for文を書くなんてRっぽくないと思ったら、outerというのがあった。2つのベクトルの交点で任意の関数を評価する外積を作れる。
ただし、マニュアルを見ると、
X and Y must be suitable arguments for FUN. Each will be extended by rep to length the products of the lengths of X and Y before FUN is called.
FUN is called with these two extended vectors as arguments. Therefore, it must be a vectorized function (or the name of one), expecting at least two arguments.
XとYはそれぞれのデータ点座標に対応するベクトルとして渡されるので、関数をベクトル化しないといけないよ、と書いてある。
multivariate_normal_distribution_2_vector <- function(x, y, mu, Sigma) {
  xx <- cbind(x,y) - matrix( rep(mu, times=length(x)), ncol=2 )
  return (
    (1/2/pi) / sqrt(det(Sigma)) *
      exp(-1/2 * rowSums((xx %*% solve(Sigma)) * xx))
  )
}

density <- outer(w0, w1, multivariate_normal_distribution_2_vector, mu, Sigma)
これで二重forループが無くなった。が、ベクトル化すると元の数式が想像できなくなるほど違った式になってしまうのが辛い。
調べたところ、これをやってくれるdmvnormという関数があるらしい。
library(mvtnorm)

density <- outer(w0, w1, function(x, y) dmvnorm(cbind(x,y), mean=mu, sigma=Sigma))
outerには無名関数を渡すこともできるので、これでだいぶコードが減った。
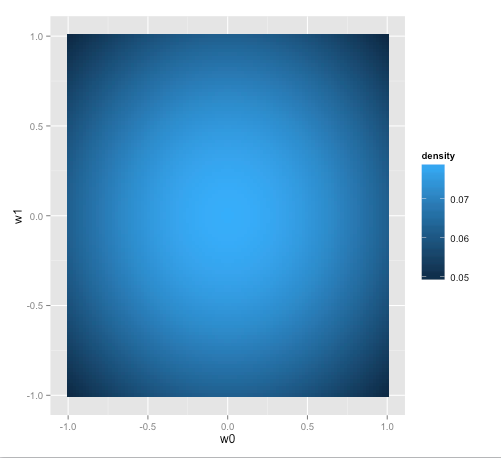
filled.contourではなくggplotを使う
ググって最初に出てきたのがfilled.contourを使う方法だったので上のようにしたが、ggplotを勉強中なのでggplotでもできないか調べた。
geom_tileというのを使えばいいらしい。ggplotを使うにはmatrixではなくdata.frameにしないといけないので、outerの代わりにexpand.gridを使うことにした。
grid <- expand.grid(w0=w0, w1=w1)
grid$density <- dmvnorm(grid, mean=mu, sigma=Sigma)
p3 <- ggplot(grid, aes(x=w0, y=w1, fill=density)) + geom_tile()
print(p3)
参考サイト
- http://entertainment-lab.blogspot.jp/2011/05/router3plot.html
- http://blog.livedoor.jp/green_idea/archives/1477686.html
- http://cse.niaes.affrc.go.jp/minaka/R/R-binormal.html
- http://siguniang.wordpress.com/2011/04/17/mandelbrot-set-in-r/
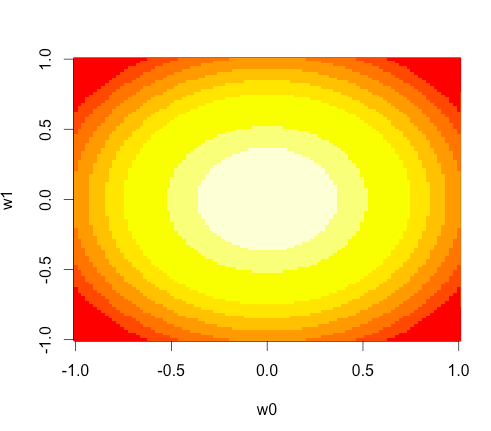
(追記)imageを使う
imageという関数を使うこともできるらしい。
density <- outer(w0, w1, function(x, y) dmvnorm(cbind(x,y), mean=mu, sigma=Sigma))

image(w0, w1, density)
まさにPRMLの同じ箇所を演習してる人の記事がQiitaのサイドバーに出てきて知った。Qiitaすばらしい。


