概要
ヘルスケア風の折れ線グラフを作ってみます。
完成イメージ
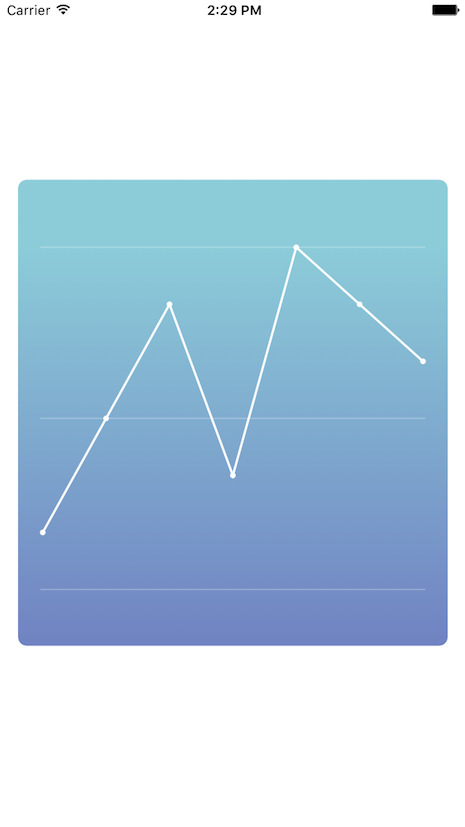
説明
UIViewのdrawRectにて折れ線グラフを描画します。
①グラデーションの描画
②X座標/Y座標の計算
③折れ線グラフの描画
④プロットの描画
⑤横軸(上/真ん中/下)の描画
参考ソースコード
GraphView.swift
import UIKit

@IBDesignable class GraphView: UIView {

    @IBInspectable var startColor: UIColor = UIColor.redColor()
    @IBInspectable var endColor: UIColor = UIColor.greenColor()

    // ダミーデータ
    var graphPoints:[Int] = [4, 2, 6, 4, 5, 8, 3]

    // グラフのプロットデータ設定用のメソッドです。
    func setupPoints(points: [Int]) {
        graphPoints = points
        self.setNeedsDisplay()
    }

    override func drawRect(rect: CGRect) {

        // グラデーションの描画
        let width = rect.width
        let height = rect.height

        let path = UIBezierPath(roundedRect: rect,
                                byRoundingCorners: UIRectCorner.AllCorners,
                                cornerRadii: CGSize(width: 8.0, height: 8.0))
        path.addClip()

        let context = UIGraphicsGetCurrentContext()
        let colors = [startColor.CGColor, endColor.CGColor]
        let colorSpace = CGColorSpaceCreateDeviceRGB()
        let colorLocations:[CGFloat] = [0.0, 1.0]
        let gradient = CGGradientCreateWithColors(colorSpace,
                                                  colors,
                                                  colorLocations)
        var startPoint = CGPoint.zero
        var endPoint = CGPoint(x:0, y:self.bounds.height)
        CGContextDrawLinearGradient(context,
                                    gradient,
                                    startPoint,
                                    endPoint,
                                    .DrawsBeforeStartLocation)


        // X座標の計算
        let margin:CGFloat = 20.0
        let columnXPoint = { (column:Int) -> CGFloat in

            let spacer = (width - margin*2 - 4) /
                CGFloat((self.graphPoints.count - 1))
            var x:CGFloat = CGFloat(column) * spacer
            x += margin + 2
            return x
        }

        // Y座標の計算
        let topBorder:CGFloat = 60
        let bottomBorder:CGFloat = 50
        let graphHeight = height - topBorder - bottomBorder
        let maxValue = graphPoints.maxElement() ?? 1
        let columnYPoint = { (graphPoint:Int) -> CGFloat in

            var y:CGFloat = CGFloat(graphPoint) / CGFloat(maxValue) * graphHeight
            y = graphHeight + topBorder - y
            return y
        }

        // 折れ線グラフの描画
        UIColor.whiteColor().setFill()
        UIColor.whiteColor().setStroke()

        let graphPath = UIBezierPath()

        graphPath.moveToPoint(CGPoint(x:columnXPoint(0),
            y:columnYPoint(graphPoints[0])))

        for i in 1..<graphPoints.count {
            let nextPoint = CGPoint(x:columnXPoint(i),
                                    y:columnYPoint(graphPoints[i]))
            graphPath.addLineToPoint(nextPoint)
        }

        graphPath.stroke()

        // 高さの調整
        let highestYPoint = columnYPoint(maxValue)
        startPoint = CGPoint(x:margin, y: highestYPoint)
        endPoint = CGPoint(x:margin, y:self.bounds.height)

        CGContextDrawLinearGradient(context,
                                    gradient,
                                    startPoint,
                                    endPoint,
                                    .DrawsBeforeStartLocation)

        graphPath.lineWidth = 2.0
        graphPath.stroke()

        // プロットの描画
        for i in 0..<graphPoints.count {
            var point = CGPoint(x:columnXPoint(i), y:columnYPoint(graphPoints[i]))
            point.x -= 5.0/2
            point.y -= 5.0/2

            let circle = UIBezierPath(ovalInRect:
                CGRect(origin: point,
                    size: CGSize(width: 5.0, height: 5.0)))

            circle.fill()
        }

        let linePath = UIBezierPath()

        // 上のラインの描画
        linePath.moveToPoint(CGPoint(x:margin, y: topBorder))
        linePath.addLineToPoint(CGPoint(x: width - margin,
            y:topBorder))


        // 中央のラインの描画
        linePath.moveToPoint(CGPoint(x:margin,
            y: graphHeight/2 + topBorder))
        linePath.addLineToPoint(CGPoint(x:width - margin,
            y:graphHeight/2 + topBorder))


        // 下のラインの描画
        linePath.moveToPoint(CGPoint(x:margin,
            y:height - bottomBorder))
        linePath.addLineToPoint(CGPoint(x:width - margin,
            y:height - bottomBorder))
        let color = UIColor(white: 1.0, alpha: 0.3)
        color.setStroke()

        linePath.lineWidth = 1.0
        linePath.stroke()
    }
}
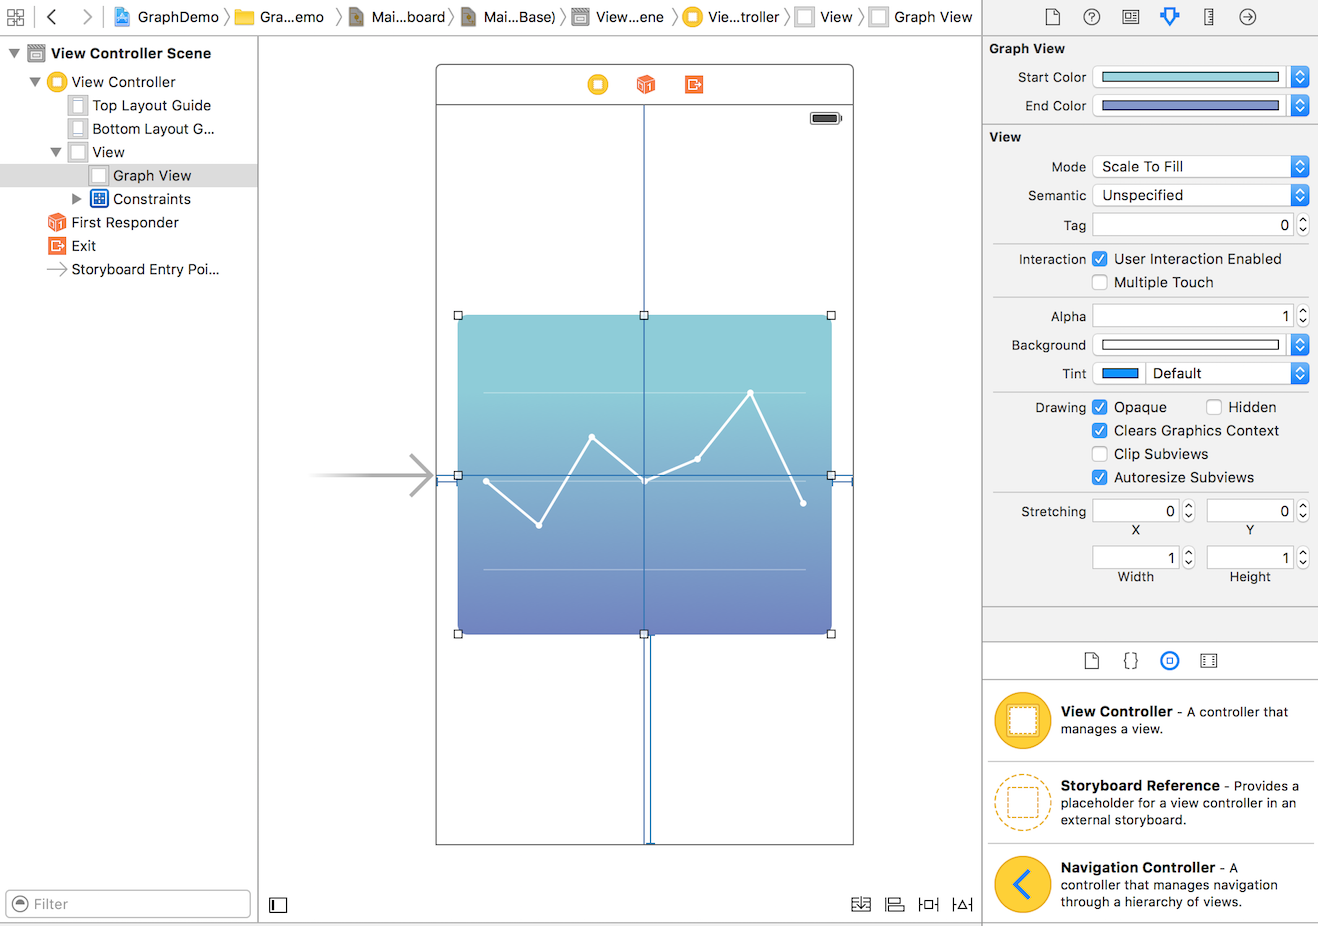
実装の仕方
① StoryboardにUIViewを配置し、Custom ClassにGraphViewを指定する。
② Graph ViewのStart ColorとEnd Colorを指定する。
本サンプルは、下記のカラーを指定しています
  Start Color RGB(140,204,217)
  End Color   RGB(112 131 194)
③ ViewControllerにOutletを設置する
ViewController.swift
import UIKit

class ViewController: UIViewController {

    @IBOutlet weak var graphView: GraphView!

    override func viewDidLoad() {
        super.viewDidLoad()
        graphView.setupPoints([1,3,5,2,6,5,4])
    }
}
御礼
Ray Wenderlich社のサイトを写経させて頂きました。
2016/12/3
Swift3対応しました。
Githubを御覧ください