こんにちは、オークファンの @dz_ こと大平かづみです。
Prologue - はじめに
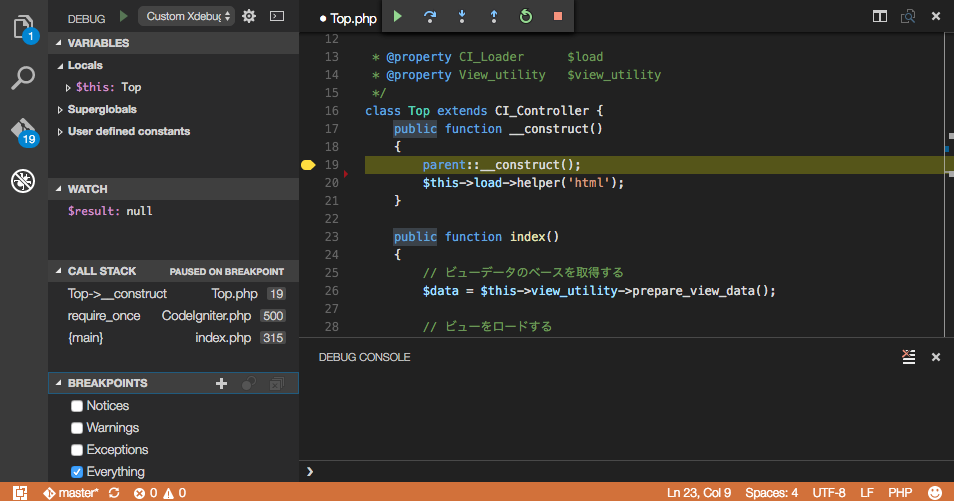
プライベートでも使っている Visual Studio Code で PHP デバッグができるように、 PHP Debug の拡張機能を導入してみました!
Visual Studio Code とは?
さて、 Visual Studio Code は、Microsoft 製のオープンソースのエディタです。
Javascript をはじめ、 PHP もある程度補完してくれ、シンプルながら使いやすいエディタです。Windows はもちろん、Mac, Linux でも利用できるので、両刀遣いとしても重宝します。
Visual Studio Code > Debuggers > PHP Debug
前提
- 接続先のサーバーに xdebug がインストールされていること
おおまかな流れ
- 接続先サーバーの xdebug を設定する
- Visual Studio Code の拡張機能をインストールする
- Visual Studio Code デバッグ設定をする
手順
接続先サーバーの xdebug を設定する
接続先サーバーの xdebug の設定が以下のようになってることを確認してください。
xdebug.remote_enable=1
xdebug.remote_autostart=1
Visual Studio Code の拡張機能をインストールする
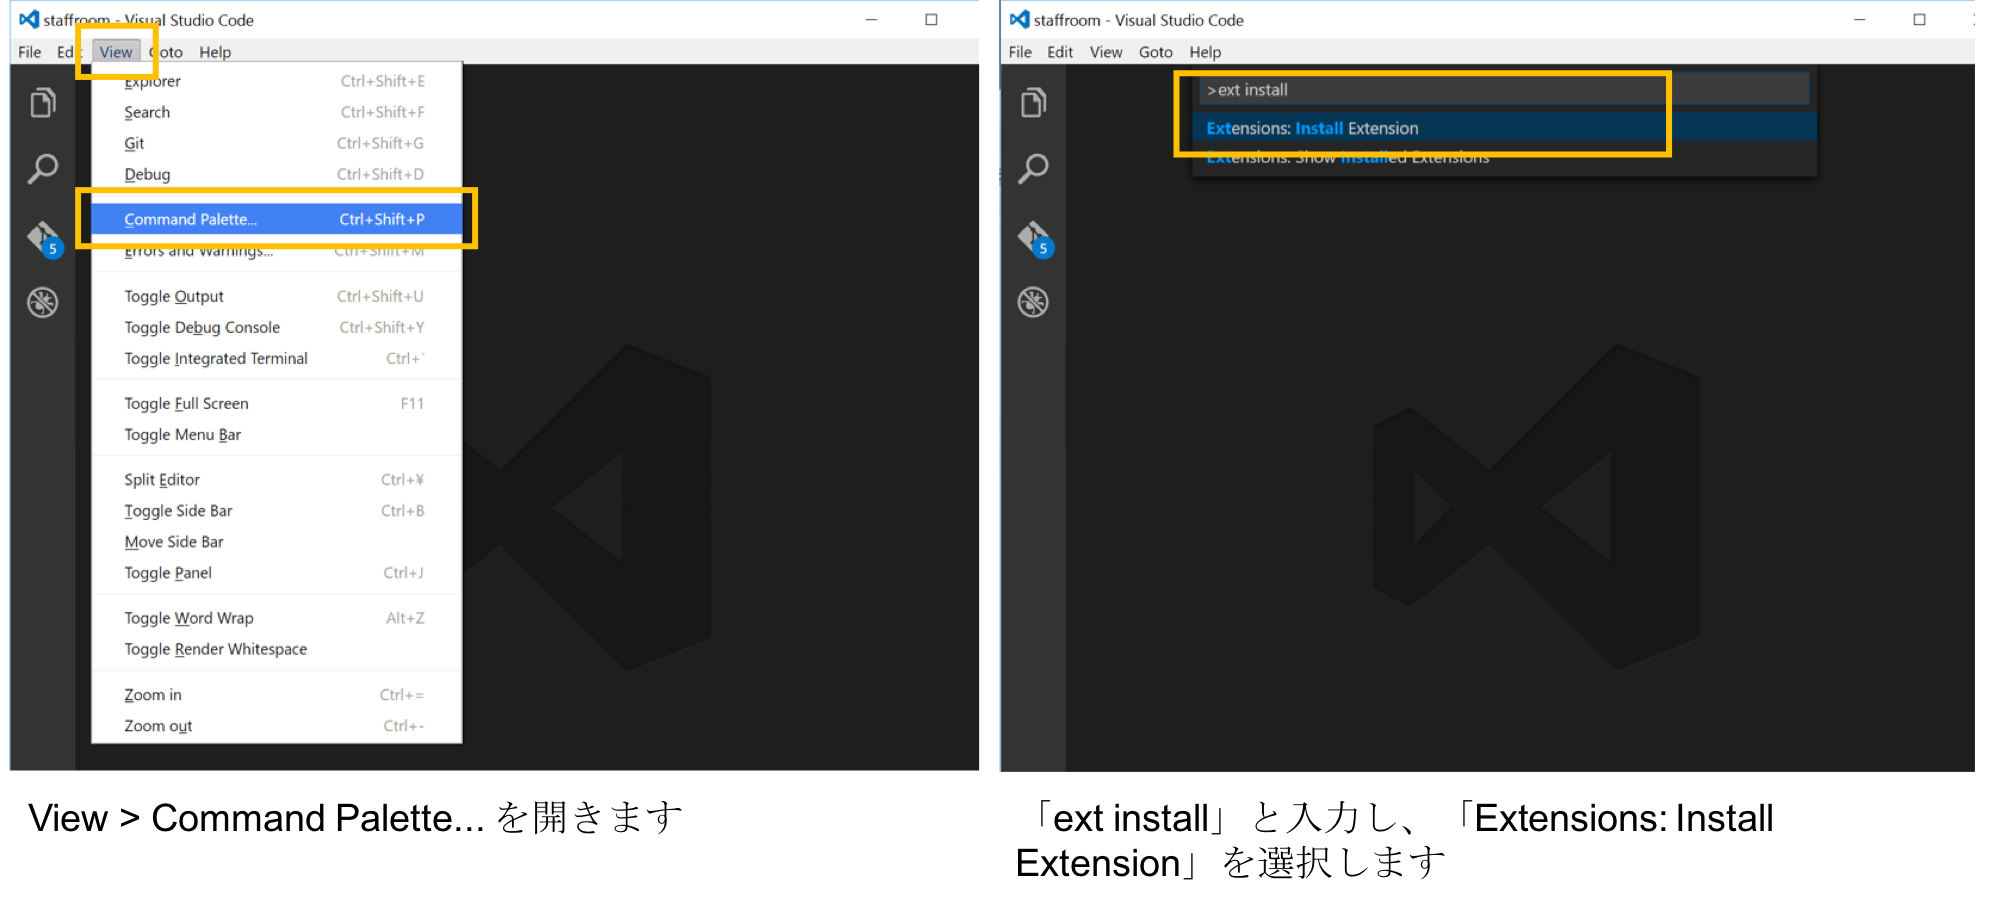
Visual Studio Code のコマンドパレットを開き、「ext install」と入力して、「Extensions: Install Extension」をクリックします。
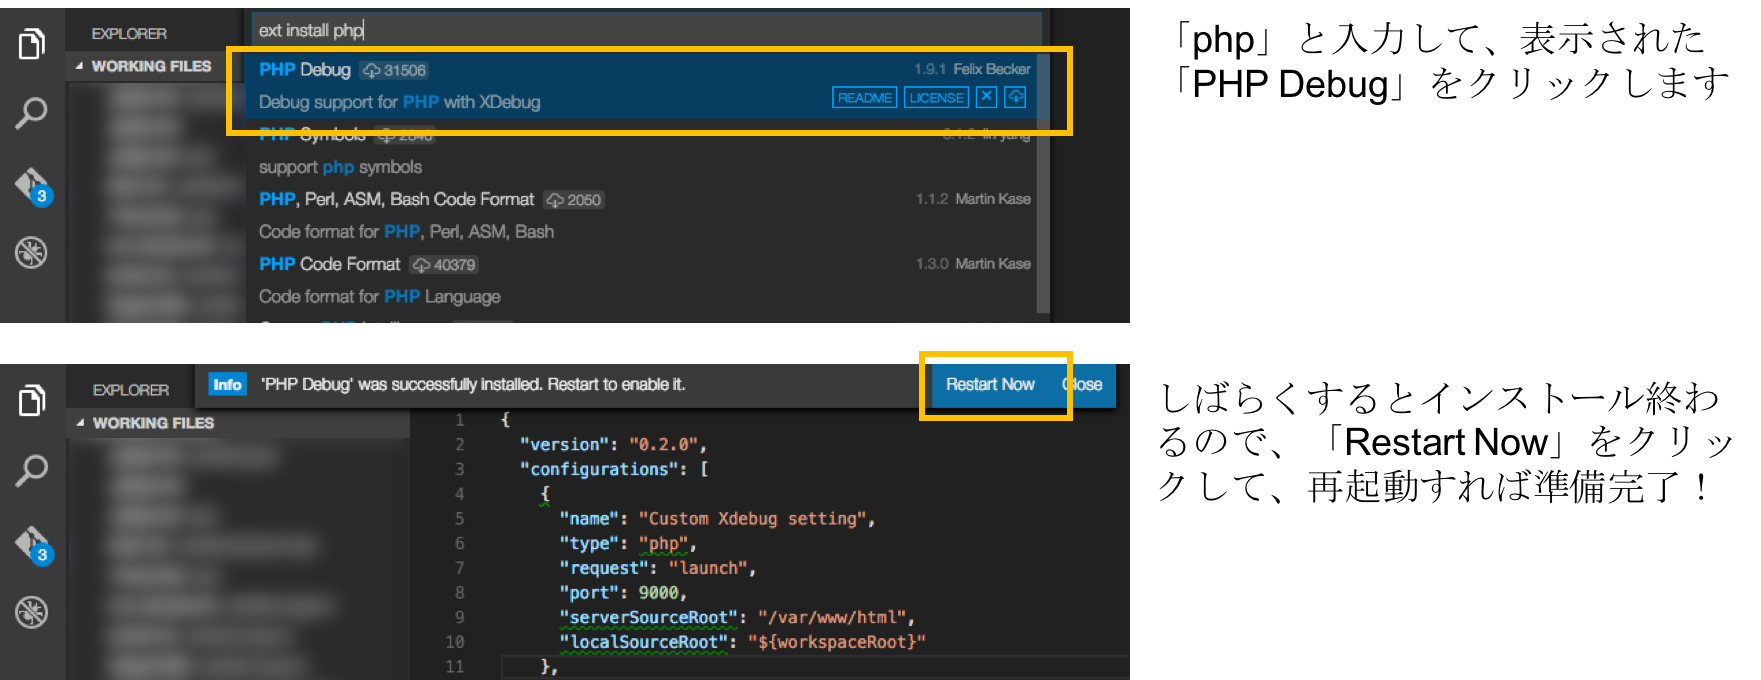
PHP Debug をクリックし、インストールします。
Visual Studio Code のデバッグ設定をする
Visual Studio Code で、デバッグするコードを含むディレクトリを開きます。
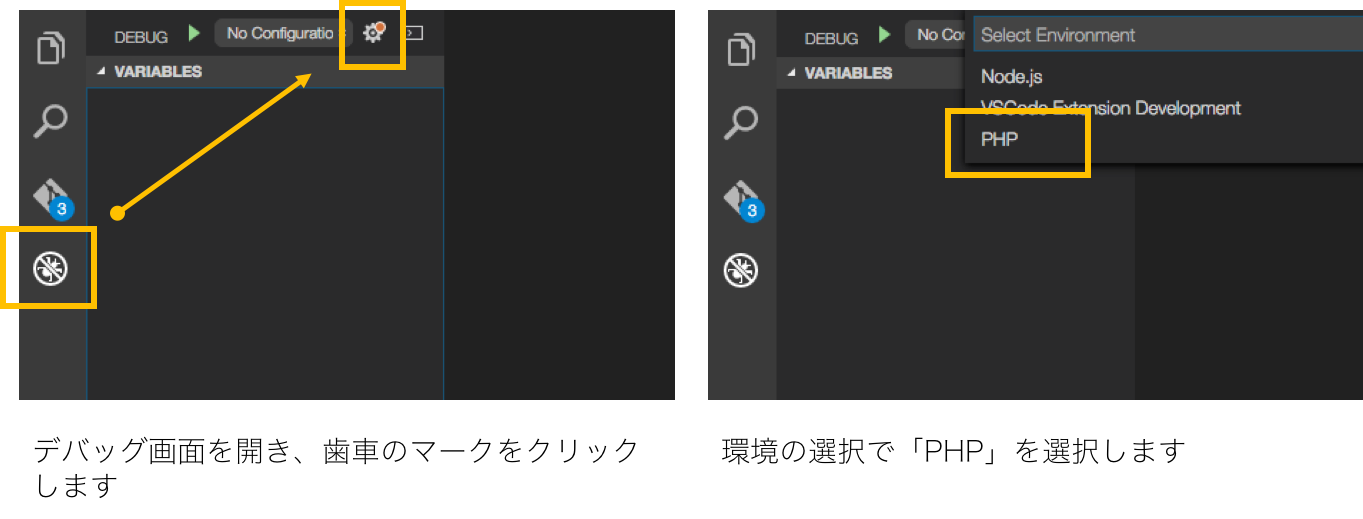
デバッグ画面を開き、歯車のマークをクリックし、環境設定を開きます。
launch.json が開かれるので、以下のように設定します。
.vscode/launch.json
{
  "version": "0.2.0",
  "configurations": [
    //-- ここから
    {
      "name": "Custom Xdebug setting",
      "type": "php",
      "request": "launch",
      "port": 9000,
      "serverSourceRoot": "/var/www/html",
      "localSourceRoot": "${workspaceRoot}"
    }
    //-- ここまで
  ]
}
| 項目 | 内容 |
|---|---|
name |
設定の名前 (任意の文字列) |
type |
php |
request |
launch |
port |
xdebug のポート (デフォルトでは 9000 ) |
serverSourceRoot |
接続先サーバー上のドキュメントルート |
localSourceRoot |
ローカルマシン上のソースコードのディレクトリ ( ${workspaceRoot} は Visual Studio Code で開いているディレクトリ) |
Epilogue - おわりに
しばらく使ってますが、とくに不便なく利用しています。ぜひ使ってみてください!