プログラム概要
四角形要素を用いるFEMプログラム用の試験データ作成の一助とするため,矩形領域要素分割プログラムを作りました.
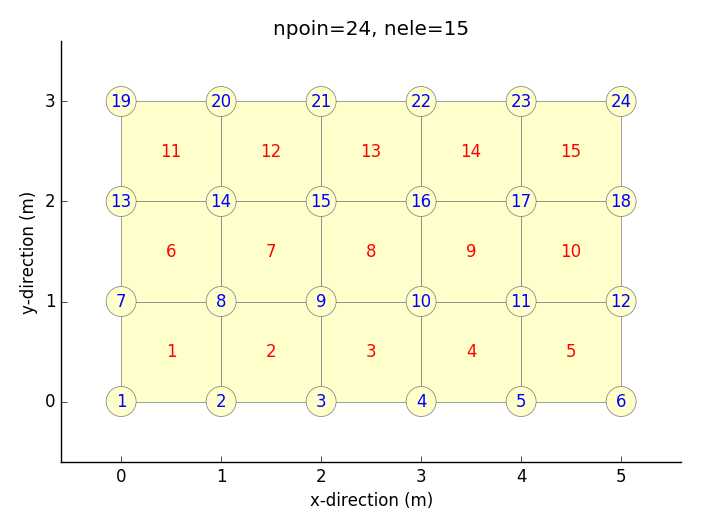
モデル化したい矩形領域の寸法・分割数などを入力することにより,節点数・要素数・要素-節点関係・節点座標を出力します.作成データ確認のため,matplotlib により,モデル図も出力するようにしました.
下の記事は、matplotlib の patches の使い方について、とても参考になります。
http://matthiaseisen.com/matplotlib/
矩形領域要素分割プログラム
py_rectmesh.py
# Meshing of rectangular domain
import numpy as np
import sys
import matplotlib.pyplot as plt
import matplotlib.patches as patches
# (Reference site) http://matthiaseisen.com/matplotlib/

param=sys.argv
aa=float(param[1]) # length in x-direction
bb=float(param[2]) # length in y-direction
nn=int(param[3])   # division number in x-direction
mm=int(param[4])   # division number in y-direction
x0=float(param[5]) # x-coordinate at left bottom of the domain
y0=float(param[6]) # y-coordinate at left bottom of the domain

npoin=(nn+1)*(mm+1)
nele=nn*mm
node=np.zeros([4,nele],dtype=np.int)
x=np.zeros([2,npoin],dtype=np.float64)

k=-1
for i in range(0,mm+1):
    for j in range(0,nn+1):
        k=k+1
        x[0,k]=aa/float(nn)*float(j)+x0
        x[1,k]=bb/float(mm)*float(i)+y0
ne=-1
for k in range(0,mm):
    i0=1+(nn+1)*k
    for j in range(0,nn):
        i=i0+j
        ne=ne+1
        node[0,ne]=i
        node[1,ne]=i+1
        node[2,ne]=node[1,ne]+nn+1
        node[3,ne]=node[2,ne]-1

print('{0:5d} {1:5d}'.format(npoin,nele))
for ne in range(0,nele):
    ss=''
    for i in range(0,4):
        ss=ss+'{0:5d}'.format(node[i,ne])
    ss=ss+'{0:5d}'.format(ne+1)
    print(ss)
for nd in range(0,npoin):
    ss=''
    for i in range(0,2):
        ss=ss+'{0:10.3f}'.format(x[i,nd])
    ss=ss+'{0:5d}'.format(nd+1)
    print(ss)

# Drawing
axmin=np.min(x[0,:])
axmax=np.max(x[0,:])
aymin=np.min(x[1,:])
aymax=np.max(x[1,:])
ra=np.min([axmax-axmin,aymax-aymin])
xmin=axmin-0.2*ra
xmax=axmax+0.2*ra
ymin=aymin-0.2*ra
ymax=aymax+0.2*ra

fnameF='fig_mesh.png'
fig = plt.figure()
ax1=plt.subplot(111)
ax1.set_xlim([xmin,xmax])
ax1.set_ylim([ymin,ymax])
ax1.set_xlabel('x-direction (m)')
ax1.set_ylabel('y-direction (m)')
ax1.spines['right'].set_visible(False)
ax1.spines['top'].set_visible(False)
ax1.yaxis.set_ticks_position('left')
ax1.xaxis.set_ticks_position('bottom')
ax1.set_aspect('equal', 'datalim')

# mesh
for ne in range(0,nele):
    n1=node[0,ne]-1; x1=x[0,n1]; y1=x[1,n1]
    n2=node[1,ne]-1; x2=x[0,n2]; y2=x[1,n2]
    n3=node[2,ne]-1; x3=x[0,n3]; y3=x[1,n3]
    n4=node[3,ne]-1; x4=x[0,n4]; y4=x[1,n4]
    ax1.fill([x1,x2,x3,x4],[y1,y2,y3,y4],facecolor='#ffffcc',edgecolor='#777777',lw=0.5)
# node number
for i in range(0,npoin):
    ax1.add_patch(patches.Circle((x[0,i],x[1,i]),0.05*ra,facecolor='#ffffcc',edgecolor='#777777',lw=0.5))
    ax1.text(x[0,i],x[1,i],str(i+1),ha='center',va='center',fontsize=12,color='#0000ff')
# element number
for ne in range(0,nele):
    n1=node[0,ne]-1; x1=x[0,n1]; y1=x[1,n1]
    n2=node[1,ne]-1; x2=x[0,n2]; y2=x[1,n2]
    n3=node[2,ne]-1; x3=x[0,n3]; y3=x[1,n3]
    n4=node[3,ne]-1; x4=x[0,n4]; y4=x[1,n4]
    x0=0.25*(x1+x2+x3+x4)
    y0=0.25*(y1+y2+y3+y4)
    ax1.text(x0,y0,str(ne+1),ha='center',va='center',fontsize=12,color='#ff0000')

ss='npoin='+str(npoin)+', nele='+str(nele)
ax1.set_title(ss)
plt.savefig(fnameF, bbox_inches="tight", pad_inches=0.2)
plt.show()
出力事例
実行用スクリプトフォーマット
python py_rectmesh.py aa bb nn mm x0 y0 > out.txt
| aa | :領域のx方向長さ |
| bb | :領域のy方向長さ |
| nn | :領域のx方向分割数 |
| mm | :領域のy方向分割数 |
| x0 | :領域の左下隅のx座標 |
| y0 | :領域の左下隅のy座標 |
| out.txt | :出力ファイル名 |
実行用スクリプ事例
python py_rectmesh.py 5 3 5 3 0 0 > _test.txt
出力データ事例
出力されるのは,節点数・要素数・要素-節点関係・節点座標です.
要素-節点関係の出力列の最後に要素番号が出力されますが,これは参考データです.
また,節点座標の出力列の最後に節点番号が出力されますが,これも参考データです.
   24    15                 # number of nodes, number of elements
    1    2    8    7    1   # element-node relationship
    2    3    9    8    2   # node-1, node-2, node-3, node-4, element_number(reference)
    3    4   10    9    3
    4    5   11   10    4
    5    6   12   11    5
    7    8   14   13    6
    8    9   15   14    7
    9   10   16   15    8
   10   11   17   16    9
   11   12   18   17   10
   13   14   20   19   11
   14   15   21   20   12
   15   16   22   21   13
   16   17   23   22   14
   17   18   24   23   15
     0.000     0.000    1  # x-coordinate, y-coordinate, node_number(reference)
     1.000     0.000    2
     2.000     0.000    3
     3.000     0.000    4
     4.000     0.000    5
     5.000     0.000    6
     0.000     1.000    7
     1.000     1.000    8
     2.000     1.000    9
     3.000     1.000   10
     4.000     1.000   11
     5.000     1.000   12
     0.000     2.000   13
     1.000     2.000   14
     2.000     2.000   15
     3.000     2.000   16
     4.000     2.000   17
     5.000     2.000   18
     0.000     3.000   19
     1.000     3.000   20
     2.000     3.000   21
     3.000     3.000   22
     4.000     3.000   23
     5.000     3.000   24
出力図事例
以 上