はじめに
仕事である数値計算をした.プログラムは以前から持っていたPythonのものを改良したものだが,収束計算を伴うものであり,以前から計算手順を示すための簡単なフローチャートのようなものを作りたいと思っていた.そこで,Pythonで「フローチャートのようなもの」を作るプログラムを作ってみた.
色々考えてみたが,結局は妙案は生まれず,グラフ用紙に定規と鉛筆で手書きするものを,Polygonとtextをコードに埋め込んで手書きと同じことをコンピュータにやらせるだけの内容となった.
はじめはフローチャートだけのつもりだったが,変数説明など関連事項も同じトーンのほうがかっこいいので,ついでに表を作るプログラムも作ってみた.本質的にはフローチャート用プログラムと何ら変わりはない.プログラムの内容は超原始的であるが,出力は白黒ながら結構かっこいいかも(自己満足です).
プログラミング環境は,コンピュータ:MacBook Pro (Retina, 13-inch, Mid 2014),Python 3.5.2である.なお私は海外駐在勤務中なので特に日本語で出力しなければならないニーズはなく,出力は下手くそな英語の表現となっていることは勘弁していただきます.
このようなものをPythonで作るメリットとは......
- matplotlibはTeX方式記述で数式表示ができるので数式を含む表示が可能(ただし分数\fracは表示不能?)
- プログラムなので,表示位置を座標で指定でき,ボックスの大きさが微妙に違ったり,線がはみ出したり届かなかったりという,くだらないことで気をもむ必要がない
- インタープリタなのでプログラム本体をガンガンいじって何度も実行させても何とも思わない
- 一度作っておくと使い回しで同じようなものを作るときの手間が省ける
といったところであろうか.
もっと効率的にこのような図がかけるよういずれは工夫してみたい.
プログラミング
プログラム本体の一部を以下に示す.
- 表示領域はA4縦用紙への出力のイメージで横16cmx縦25cm,あるいはその相似形をイメージしている.
- コマンドライン引数で,グラフ用紙のグリッドと軸を表示する(作業中)・しない(完成品)を区別して画像出力できるようにしてある.
- 画像出力されたグラフ用紙を見ながら,コードリスト中の (something to draw) と書かれているところに,書きたいものを挿入していく.
- dh(=0.7) という変数を使っているが,これは1行あたりの高さを示すもので,フォントの大きさに応じて表示するグラフ用紙のグリッド高を変更できるようにしている.
- 変数dh=0.7の次の部分では,縦軸の表示を変更している.すなわち,作図範囲として定義した縦軸座標は0−25であるのに対し,行高0.7ピッチでグリッドを表示すれば,縦軸表示は
A=[0, 0.7, 1.4, ...]となるが,使いづらいので,これをB=[0, 1, 2, ...]という表示に変更する手続きの準備をしている.実際の縦軸座標の表示は,plt.yticks(A,B)で行っている.
# Flowchart
from math import *
import sys
import matplotlib.pyplot as plt
from matplotlib.patches import Polygon
from matplotlib.ticker import *

param=sys.argv
iflag=int(param[1]) # flag for axis drawing
# 0: without axis and grid, 1: with axis and grid

# drawing area: w x h = 16 x 25 imaged A4 paper
xmin=-8
xmax=8
ymin=0
ymax=25
dh=0.7 # height of one row
A=[]   # actural y-axis
B=[]   # grid number in y-axis
for i in range(0,int(ymax//dh)+1):
    s='{0:.1f}'.format(dh*i)
    A=A+[float(s)]
    B=B+[i]

fnameF='fig_flowchart.png'
fig = plt.figure()
ax1=plt.subplot(111)
ax1 = plt.gca()
ax1.set_xlim([xmin,xmax])
ax1.set_ylim([ymax,ymin])
aspect = (abs(ymax-ymin))/(abs(xmax-xmin))*abs(ax1.get_xlim()[1] - ax1.get_xlim()[0]) / abs(ax1.get_ylim()[1] - ax1.get_ylim()[0])
ax1.set_aspect(aspect)
if iflag==0:
    plt.axis('off')
else:
    ax1.tick_params(labelsize=6)
    ax1.xaxis.set_major_locator(MultipleLocator(1))
    ax1.yaxis.set_major_locator(MultipleLocator(dh))
    plt.yticks(A,B)
    plt.grid(which='both',lw=0.3, color='#cccccc',linestyle='-')

#################################################
#                                               #
#     (something to draw)                       #
#                                               #
#################################################

plt.savefig(fnameF, dpi=200, bbox_inches="tight", pad_inches=0.2)
# plt.show()
| プログラム | 説明 |
|---|---|
| py_fig_flowchart.py | フローチャート作成プログラム |
| py_fig_table.py | 表作成プログラム |
成果品
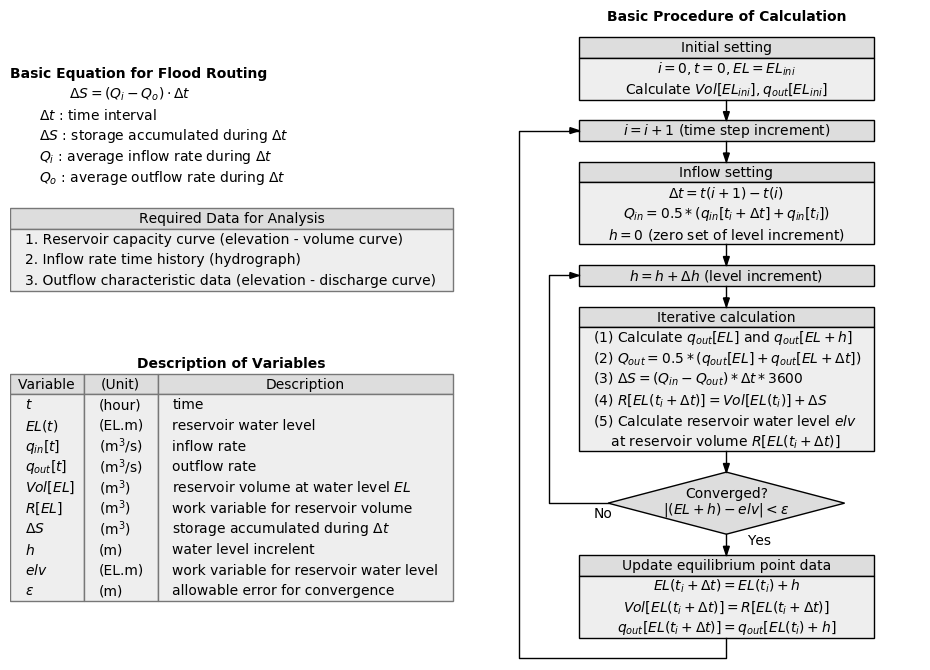
成果図の左側は表作成プログラムで,右側はフローチャート作成プログラムで描画したものであり,ImageMagickで結合して1枚の画像にしている.
実行スクリプトは以下の通り.
python py_fig_flowchart.py 0
python py_fig_table.py 0

convert -trim fig_flowchart.png -bordercolor 'white' -border 10x10 fig_flowchart.png
convert -trim fig_table.png -bordercolor 'white' -border 10x10 fig_table.png

montage -tile 2x1 -geometry 465x670 fig_table.png fig_flowchart.png fig_floodroutine.png
成果品は以下の通り.「このフローは無限ループか?」とかのツッコミは無しです.
以 上
