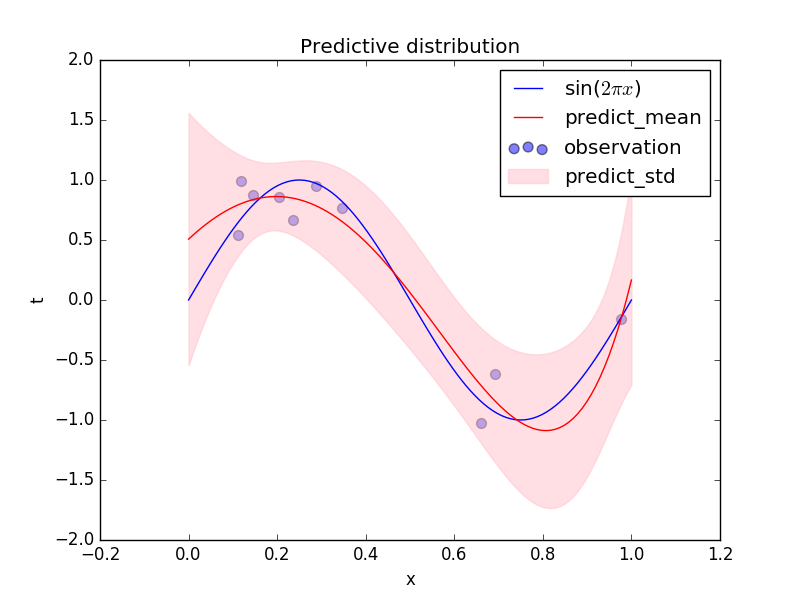
自分の勉強のためにPRMLで紹介されている手法の幾つかをピックアップして、Pythonで実装していくことにしました。基本的には、Pythonの標準ライブラリ以外に使っていいのはnumpyだけというルール(そのうちscipyぐらいは使ってるかも)でコーディングしていきます。ただし、matplotlibなどはアルゴリズムの部分とは関係ないので例外とします。
ベイズ曲線フィッティング
ベイズ曲線フィッティングは、完全にベイズ的な取り扱いをすることで曲線をフィッティングする手法となっています。 最尤推定による予測分布ではどの点についても同じ分散となるのに対して、ベイズ曲線フィッティングではパラメータの事後分布を使ってベイズ的に(確率の加法・乗法定理を使って)予測分布を求めることで、各々の点について分散を計算することができます。各点について比較的自信のある予測なのかどうかを計算してくれます。
実装
一番最初の宣言通り、アルゴリズムの実装はnumpyを使います。
import matplotlib.pyplot as plt
import numpy as np
計画行列(design matrix)の計算
$$
{\bf\Phi} =
\begin{bmatrix}
\phi_0(x_0) & \phi_1(x_0) & \cdots & \phi_{M-1}(x_0)\
\phi_0(x_1) & \phi_1(x_1) & \cdots & \phi_{M-1}(x_1)\
\vdots & \vdots & \ddots & \vdots\
\phi_0(x_{N-1}) & \phi_1(x_{N-1}) & \cdots & \phi_{M-1}(x_{N-1})\
\end{bmatrix}
$$今回は多項式回帰ですので$\phi_i(x)=x^i$としています。この計画行列${\bf\Phi}$はPRMLの第3章で登場しますが、一つの行が一つの特徴ベクトルに対応します。特徴ベクトル${\bf\phi}(x)$はもともと縦ベクトルでしたが、ここでは横方向と対応しています。
class PolynomialFeatures(object):

    def __init__(self, degree):
        self.degree = degree

    def transform(self, x):
        features = [x ** i for i in xrange(self.degree + 1)]
        return np.array(features).transpose()
ベイズ曲線フィッティングの推定と予測
まずパラメータ${\bf w}$の事後分布を推定します。
$$
p({\bf w}|{\bf x}, {\bf t}, \alpha, \beta) \propto p({\bf t}|{\bf\Phi}{\bf w}, \beta)p({\bf w}|\alpha)
$$ここで${\bf x}, {\bf t}$はトレーニングセットとしています。また、右辺の$p$はどちらもガウス関数を仮定していて精度パラメータをそれぞれ$\alpha$と$\beta$としています。すると左辺の確率分布もガウス分布となります。
$$
p({\bf w}|{\bf x}, {\bf t}, \alpha, \beta) = \mathcal{N}({\bf m}, {\bf S})
$$ただし、
$$
{\bf m} = \beta{\bf S}{\bf\Phi}^{\rm T}{\bf t},~{\bf S}^{-1} = \alpha{\bf I} + \beta{\bf\Phi}^{\rm T}{\bf\Phi}
$$この事後分布を用いて新しい点$x$についての$t$の確率分布は
$$
p(t|x,{\bf x}, {\bf t}, \alpha, \beta) = \int p(t|x,{\bf w},\beta)p({\bf w}|{\bf x}, {\bf t}, \alpha, \beta){\rm d}{\bf w}
$$これもまた計算するとガウス分布になっています。
$$
p(t|x,{\bf x}, {\bf t}, \alpha, \beta) = \mathcal{N}(t|{\bf m}^{\rm T}{\bf\phi}(x), {1\over\beta}+{\bf\phi}(x)^{\rm T}{\bf S}{\bf\phi}(x))
$$
class BayesianRegression(object):

    def __init__(self, alpha=0.1, beta=0.25):
        self.alpha = alpha
        self.beta = beta

    def fit(self, X, t):
        self.w_var = np.linalg.inv(
            self.alpha * np.identity(np.size(X, 1))
            + self.beta * X.T.dot(X))
        self.w_mean = self.beta * self.w_var.dot(X.T.dot(t))

    def predict(self, X):
        y = X.dot(self.w_mean)
        y_var = 1 / self.beta + np.sum(X.dot(self.w_var) * X, axis=1)
        y_std = np.sqrt(y_var)
        return y, y_std
全体のコード
以上までも含めて実装したものが下のコードになりました。おおまかな流れは
- トレーニングデータの作成(
x, t = create_toy_data(func, ...)) - 重みパラメータ${\bf w}$の事後分布を計算(
regression.fit(X, t)) - 事後分布を使って予測分布を計算(
y, y_std = regression.predict(X_test)) - 結果を図示
となっています。
import matplotlib.pyplot as plt
import numpy as np


class PolynomialFeatures(object):

    def __init__(self, degree):
        self.degree = degree

    def transform(self, x):
        features = [x ** i for i in xrange(self.degree + 1)]
        return np.array(features).transpose()


class BayesianRegression(object):

    def __init__(self, alpha=0.1, beta=0.25):
        self.alpha = alpha
        self.beta = beta

    def fit(self, X, t):
        self.w_var = np.linalg.inv(
            self.alpha * np.identity(np.size(X, 1))
            + self.beta * X.T.dot(X))
        self.w_mean = self.beta * self.w_var.dot(X.T.dot(t))

    def predict(self, X):
        y = X.dot(self.w_mean)
        y_var = 1 / self.beta + np.sum(X.dot(self.w_var) * X, axis=1)
        y_std = np.sqrt(y_var)
        return y, y_std


def create_toy_data(func, low=0, high=1, size=10, sigma=1.):
    x = np.random.uniform(low, high, size)
    t = func(x) + np.random.normal(scale=sigma, size=size)
    return x, t


def main():

    def func(x):
        return np.sin(2 * np.pi * x)

    x, t = create_toy_data(func, low=0, high=1, size=10, sigma=0.25)
    plt.scatter(x, t, s=50, marker='o', alpha=0.5, label="observation")

    features = PolynomialFeatures(degree=5)

    regression = BayesianRegression(alpha=1e-3, beta=2)
    X = features.transform(x)
    regression.fit(X, t)

    x_test = np.linspace(0, 1, 100)
    X_test = features.transform(x_test)
    y, y_std = regression.predict(X_test)

    plt.plot(x_test, func(x_test), color='blue', label="sin($2\pi x$)")
    plt.plot(x_test, y, color='red', label="predict_mean")
    plt.fill_between(x_test, y - y_std, y + y_std,
                     color='pink', alpha=0.5, label="predict_std")
    plt.legend()
    plt.title("Predictive distribution")
    plt.xlabel("x")
    plt.ylabel("t")
    plt.show()


if __name__ == '__main__':
    main()
結果
関数${\rm sin}(2\pi x)$にノイズを加えて生成したデータ点(青点)からベイズ曲線フィッティングを行って予測しました。予測分布の各$x$での平均値を赤線、標準偏差をピンクで表しています。ピンクの帯の幅がその予測の不確かさに対応しています。もし、最尤推定による予測分布を計算した場合、ピンクの帯の幅は$x$に依らず一定となり、どの点の予測も同様に不確かという直感に合わない結果となってしまいます。今回の結果では、予測に比較的自信がない領域はあまり点がないところ($x\le0.1, 0.7\le x\le0.9$)かと思いきや、$0.4\le x \le0.6$の領域ではデータ点がなくても標準偏差が大きくなっていない。また、このような挙動は特徴ベクトルにどのようなものを用いるのかにも依存してきます。今回は多項式の特徴を用いましたが、他にもガウス関数を用いた特徴もよく用いられています。

最後に
今回は超パラメータ$\alpha, \beta$についてはうまくいきそうなものを選んできましたが、PRMLの第3章にあるエビデンス近似という手法を用いるとデータ点だけから超パラメータを推定できるようです。そちらもおいおい実装していこうと考えています。