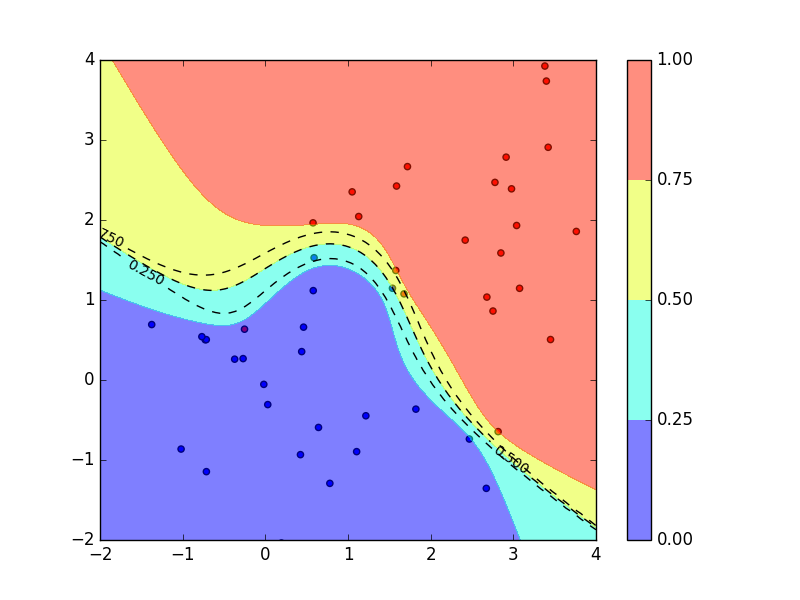
曲線フィッティングではベイズ的に扱って事後予測分布を算出したりもしますが、クラス分類においてはあまりそのようなことがやられていない印象があり、今回はクラス分類でよく用いられるロジスティック回帰をよりベイズ的に取り扱って事後予測分布を計算するコードを実装しようと思います。
ベイズロジスティック回帰
上でも書きましたが、クラス分類において予測分布を算出しているコードをあまり、というか全く見かけたことがありませんでした(ただ見てきたコードが少ないだけかも)。
ベイズ的に予測分布を計算するためには重みパラメータの事後分布を使ってパラメータについて積分消去しなければならない。しかしロジスティック回帰ではロジスティックシグモイド関数を用いているので、解析的にパラメータについて積分することはできません。そこでラプラス近似を用いて近似的に予測分布を求めます。
ロジスティック回帰
まず2クラス分類を行うロジスティック回帰を考えていきます。$\phi$をある点$x$の特徴ベクトルとして、その点がクラス$C_1$に属するを
p(C_1|\phi) = y(\phi) = \sigma({\bf w}^\intercal\phi)
と表します。ただし、$\sigma(\cdot)$はロジスティックシグモイド関数$\sigma(x)={1\over1+\exp(-x)}$とする。ここでは2クラス分類を考えているので、クラス$C_1$に属する確率が分かれば、もう一方のクラス$C_2$に属する確率は$p(C_2|\phi(x)) = 1 - p(C_1|\phi(x))$で与えられる。よって、これ以降はクラス$C_1$に属する確率の方だけを考えていく。
$\phi_n=\phi(x_n)$、$t_n\in\{0,1\}$として、トレーニングデータセット$\{\phi_n, t_n\}_{n=1}^N$が与えられたときの尤度関数はベルヌーイ分布をモデルとして、
\begin{align}
p({\bf t}|{\bf\Phi},{\bf w}) &= \prod_{n=1}^N{\rm Bern}(t_n|y_n)\\
&= \prod_{n=1}^N y_n^{t_n}(1 - y_n)^{1 - t_n}
\end{align}
となる。ただし、${\bf\Phi}$は横ベクトル$\phi^{\rm T}$を縦に並べた計画行列である。いつものようにコスト関数を負の対数尤度関数と定義すると、クロスエントロピーの形になります。
E({\bf w}) = -\ln p({\bf t}|{\bf\Phi},{\bf w}) = -\sum_{n=1}^N\{t_n\ln y_n + (1 - t_n)\ln(1 - y_n)\}
このコスト関数をパラメータ${\bf w}$について一階、二階微分した結果はそれぞれ
\begin{align}
\nabla E({\bf w}) &= \sum_{n=1}^N (y_n - t_n) {\bf\phi}_n = {\bf\Phi}^\intercal({\bf y} - {\bf t})\\
{\bf H} = \nabla\nabla E({\bf w}) &= \sum_{n=1}^N y_n(1 - y_n)\phi_n\phi_n^\intercal = {\bf\Phi}^\intercal{\bf R}{\bf\Phi}
\end{align}
ただし、行列${\bf R}$はその要素が$R_{nn}=y_n(1-y_n)$となっている対角行列である。これらの結果を用いて、
{\bf w}^{new} = {\bf w}^{old} - {\bf H}^{-1}\nabla E({\bf w})
として、パラメータ${\bf w}$が収束するまで更新を繰り返す。
ラプラス近似
パラメータ${\bf w}$について事前分布$p({\bf w})=\mathcal{N}({\bf w}|{\bf 0},\alpha^{-1}{\bf I})$を導入して、ラプラス近似を使うことでガウス関数の形になっている近似的な事後分布を求める。ベイズの定理から
p({\bf w}|{\bf t},{\bf\Phi}) \propto p({\bf t}|{\bf\Phi},{\bf w})p({\bf w})
であるから、その対数をとると
\ln p({\bf w}|{\bf t},{\bf\Phi}) = -{\alpha\over2}{\bf w}^\intercal{\bf w} + \sum_{n=1}^N\{t_n\ln y_n + (1 - t_n)\ln(1 - y_n)\}
となる。これからガウス近似を計算するために、まず上の式を${\bf w}$について最大化して、そのときのパラメータ${\bf w}_{MAP}$と二階微分$S_N^{-1}$を用いて近似的な事後分布は
q({\bf w}) = \mathcal{N}({\bf w}|{\bf w}_{MAP}, S_N)
として求められる。
事後予測分布
新しい点$\phi$についての事後予測分布は、パラメータの事後分布について周辺化することで得られる。
\begin{align}
p(C_1|\phi,{\bf t},{\bf\Phi}) &= \int p(C_1|\phi,{\bf w})p({\bf w}|{\bf t},{\bf\Phi}){\rm d}{\bf w}\\
&\approx \int \sigma({\bf w}^\intercal\phi)\mathcal{N}({\bf w}|{\bf w}_{MAP},S_N){\rm d}{\bf w}\\
&\approx \sigma\left({\mu\over\sqrt{1 + \pi\sigma^2/8}}\right)
\end{align}
ただし、
\begin{align}
\mu &= {\bf w}_{MAP}^\intercal\phi\\
\sigma^2 &= \phi^\intercal S_N\phi
\end{align}
とする。パラメータ${\bf w}$の事後分布をラプラス近似したこと、そしてロジスティックシグモイド関数をプロビット関数で近似したこと、この二つの近似が用いられています。詳しい式変形はPRMLをご覧ください。
実装
パッケージ
いつものmatplotlib、numpyに加えてitertoolsというPythonの標準ライブラリを用います。
import itertools
import matplotlib.pyplot as plt
import numpy as np
計画行列:多項式特徴
2次元の点$(x_1,x_2)$を2次の多項式特徴ベクトルに変換すると
\phi(x_1,x_2) =
\begin{bmatrix}
1\\
x_1\\
x_2\\
x_1^2\\
x_1x_2\\
x_2^2
\end{bmatrix}
となります。いくつもの2次元の点から計画行列に変換するクラスが下のものです。
例えば2次元の点$(2,5)$と$(-3,1)$の2次多項式特徴の計画行列は
{\bf\Phi}=
\begin{bmatrix}
1 & 2 & 5 & 2^2 & 2 \times 5 & 5^2\\
1 & 3 & -1 & 3^2 & 3 \times (-1) & (-1)^2
\end{bmatrix}
のようになります。
class PolynomialFeatures(object):

    def __init__(self, degree=2):
        self.degree = degree

    def transform(self, x):
        x_t = x.transpose()
        features = [np.ones(len(x))]
        for degree in xrange(1, self.degree + 1):
            for items in itertools.combinations_with_replacement(x_t, degree):
                features.append(reduce(lambda x, y: x * y, items))
        return np.array(features).transpose()
ロジスティック回帰
ロジスティック回帰とベイズロジスティック回帰を行うクラスを別々に分ける必要はないのですが、二つの違いを顕著にするために今回は分けました。
class LogisticRegression(object):

    def __init__(self, iter_max, alpha=0):
        self.iter_max = iter_max
        self.alpha = alpha

    def _sigmoid(self, a):
        return np.divide(1, 1 + np.exp(-a))

    def fit(self, X, t):
        self.w = np.zeros(np.size(X, 1))
        for i in xrange(self.iter_max):
            w = np.copy(self.w)
            y = self.predict_proba(X)
            grad = X.T.dot(y - t) + self.alpha * w
            hessian = (X.T.dot(np.diag(y * (1 - y))).dot(X)
                       + self.alpha * np.identity(len(w)))
            try:
                self.w -= np.linalg.solve(hessian, grad)
            except np.linalg.LinAlgError:
                break
            if np.allclose(w, self.w):
                break
            if i == self.iter_max - 1:
                print "weight parameter w may not have converged"

    def predict(self, X):
        return (self.predict_proba(X) > 0.5).astype(np.int)

    def predict_proba(self, X):
        return self._sigmoid(X.dot(self.w))
| LogisticRegression | メソッドの説明 |
|---|---|
| __init__ | パラメータの最大更新回数、パラメータの事前分布の精度の設定 |
| _sigmoid | ロジスティックシグモイド関数 |
| fit | パラメータの推定 |
| predict | 入力のラベルを予測 |
| predict_proba | 入力がラベル1となる確率を計算 |
ベイズロジスティック回帰
パラメータの最大事後確率推定において最頻値だけでなく近似的な分散も求めています。上のロジスティック回帰でもヘッセ行列(近似的なパラメータの精度行列)を求めていましたが、それは推定しているときにその行列を使っているだけなのでその行列を何らかの変数に保存してはいませんが、ベイズロジスティック回帰ではパラメータの分散も使って予測分布を計算するので保存しています。そして、そのパラメータの分散行列もつかって予測分布を計算しているのが、predict_distメソッドになります。
class BayesianLogisticRegression(LogisticRegression):

    def __init__(self, iter_max, alpha=0.1):
        super(BayesianLogisticRegression, self).__init__(iter_max, alpha)

    def fit(self, X, t):
        super(BayesianLogisticRegression, self).fit(X, t)
        y = self.predict_proba(X)
        hessian = (X.T.dot(np.diag(y * (1 - y))).dot(X)
                   + self.alpha * np.identity(len(self.w)))
        self.w_var = np.linalg.inv(hessian)

    def predict_dist(self, X):
        mu_a = X.dot(self.w)
        var_a = np.sum(X.dot(self.w_var) * X, axis=1)
        return self._sigmoid(mu_a / np.sqrt(1 + np.pi * var_a / 8))
| BayesianLogisticRegression | メソッドの説明 |
|---|---|
| __init__ | パラメータの最大更新回数、パラメータの事前分布の精度の設定 |
| fit | パラメータの推定 |
| predict_dist | 入力に対する事後予測分布の計算 |
コード全体
import itertools
import matplotlib.pyplot as plt
import numpy as np


class PolynomialFeatures(object):

    def __init__(self, degree=2):
        self.degree = degree

    def transform(self, x):
        x_t = x.transpose()
        features = [np.ones(len(x))]
        for degree in xrange(1, self.degree + 1):
            for items in itertools.combinations_with_replacement(x_t, degree):
                features.append(reduce(lambda x, y: x * y, items))
        return np.array(features).transpose()


class LogisticRegression(object):

    def __init__(self, iter_max, alpha=0):
        self.iter_max = iter_max
        self.alpha = alpha

    def _sigmoid(self, a):
        return np.divide(1, 1 + np.exp(-a))

    def fit(self, X, t):
        self.w = np.zeros(np.size(X, 1))
        for i in xrange(self.iter_max):
            w = np.copy(self.w)
            y = self.predict_proba(X)
            grad = X.T.dot(y - t) + self.alpha * w
            hessian = (X.T.dot(np.diag(y * (1 - y))).dot(X)
                       + self.alpha * np.identity(len(w)))
            try:
                self.w -= np.linalg.inv(hessian).dot(grad)
            except np.linalg.LinAlgError:
                break
            if np.allclose(w, self.w):
                break
            if i == self.iter_max - 1:
                print "weight parameter w may not have converged"

    def predict(self, X):
        return (self.predict_proba(X) > 0.5).astype(np.int)

    def predict_proba(self, X):
        return self._sigmoid(X.dot(self.w))


class BayesianLogisticRegression(LogisticRegression):

    def __init__(self, iter_max, alpha=0.1):
        super(BayesianLogisticRegression, self).__init__(iter_max, alpha)

    def fit(self, X, t):
        super(BayesianLogisticRegression, self).fit(X, t)
        y = self.predict_proba(X)
        hessian = (X.T.dot(np.diag(y * (1 - y))).dot(X)
                   + self.alpha * np.identity(len(self.w)))
        self.w_var = np.linalg.inv(hessian)

    def predict_dist(self, X):
        mu_a = X.dot(self.w)
        var_a = np.sum(X.dot(self.w_var) * X, axis=1)
        return self._sigmoid(mu_a / np.sqrt(1 + np.pi * var_a / 8))


def create_data_set():
    x = np.random.normal(size=50).reshape(-1, 2)
    y = np.random.normal(size=50).reshape(-1, 2)
    y += np.array([2., 2.])
    return (np.concatenate([x, y]), np.concatenate([np.zeros(25), np.ones(25)]))


def main():
    x, labels = create_data_set()
    colors = ['blue', 'red']
    plt.scatter(x[:, 0], x[:, 1], c=[colors[int(label)] for label in labels])

    features = PolynomialFeatures(degree=3)

    classifier = BayesianLogisticRegression(iter_max=100, alpha=0.1)
    classifier.fit(features.transform(x), labels)

    X_test, Y_test = np.meshgrid(np.linspace(-2, 4, 100), np.linspace(-2, 4, 100))
    x_test = np.array([X_test, Y_test]).transpose(1, 2, 0).reshape(-1, 2)
    probs = classifier.predict_proba(features.transform(x_test))
    Probs = probs.reshape(100, 100)
    dists = classifier.predict_dist(features.transform(x_test))
    Dists = dists.reshape(100, 100)
    levels = np.linspace(0, 1, 5)
    cp = plt.contour(X_test, Y_test, Probs, levels, colors='k', linestyles='dashed')
    plt.clabel(cp, inline=True, fontsize=10)
    plt.contourf(X_test, Y_test, Dists, levels, alpha=0.5)
    plt.colorbar()
    plt.xlim(-2, 4)
    plt.ylim(-2, 4)
    plt.show()


if __name__ == '__main__':
    main()
結果
- 学習データ:青(クラス0)、赤(クラス1)の点
- 黒の点線:ロジスティック回帰の出力、見にくくなっていますが上からクラス1に属する確率が0.75,0.5,0.25の線
-
色分け:ベイズロジスティック回帰の出力、それぞれクラス1に属する確率が
- 赤:0.75〜
- 黄:0.5〜0.75
- 水:0.25〜0.5
- 青:〜0.25
これを見ると、確率0.5の線(真ん中の点線と水色と黄色の境界線)はどちらの場合も共通しているのに対して、0.25と0.75の線はベイズ的に扱った方はより0.5の線から離れていて、どちらのクラスに属するのか曖昧であることを伝えています。さらに、図の左上のデータ点が全然ないところでは他の領域よりも予測分布がより曖昧になるようになっている。それに対して、中心のあたりではデータ点が多いので0.25から0.75までの幅が狭くなっている。
クラス1に属している確率をどちらかの方法で計算した後、何らかの決定基準によってどちらかのクラスに割り当てるのですが、決定基準が誤分類最小化であればどちらを使っても変わりません。なぜなら確率0.5の線が共通しているからです。しかし、より複雑な決定基準を用いる場合はベイズ的な扱いをしたほうがいいかもしれません。
終わりに
今回はラプラス近似を利用してベイズロジスティック回帰を行う手法を実装しました。ベイズ的に扱う利点としては、データ点が多く存在する領域とそうでないところとで異なる挙動をすることでしょうか。
ラプラス近似を用いるもの以外にも変分ベイズをつかって予測分布を導出する方法もあるそうです。PRMLの第10章では変分ベイズを使って、超パラメータ$\alpha$の推定も行っています。そちらも実装してみようかと思います。
