はじめに
Grafana 2.1 で追加された、同じグラフを大量に作る Repeating Rows and Panels のやり方が公式ドキュメントに無かったので、やり方を書いてみます。誰かの助けになれば。
Repeating Rows and Panels とは?
公式サイトの What’s new in Grafana v2.1 にある通り、ほとんど同じグラフを大量に作るときに重宝する機能です。複数サーバのCPU使用率をまとめて見たりするときには必須だし、What's New で大々的に取り上げてるというのに、設定方法がドキュメントに書いてないんですよね。(簡単だから書くまでもない?)
設定方法
1.templateを設定
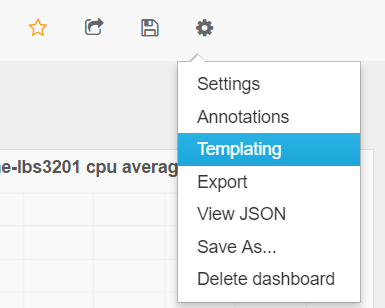
まずは、ギアアイコンから Templating をクリックし、

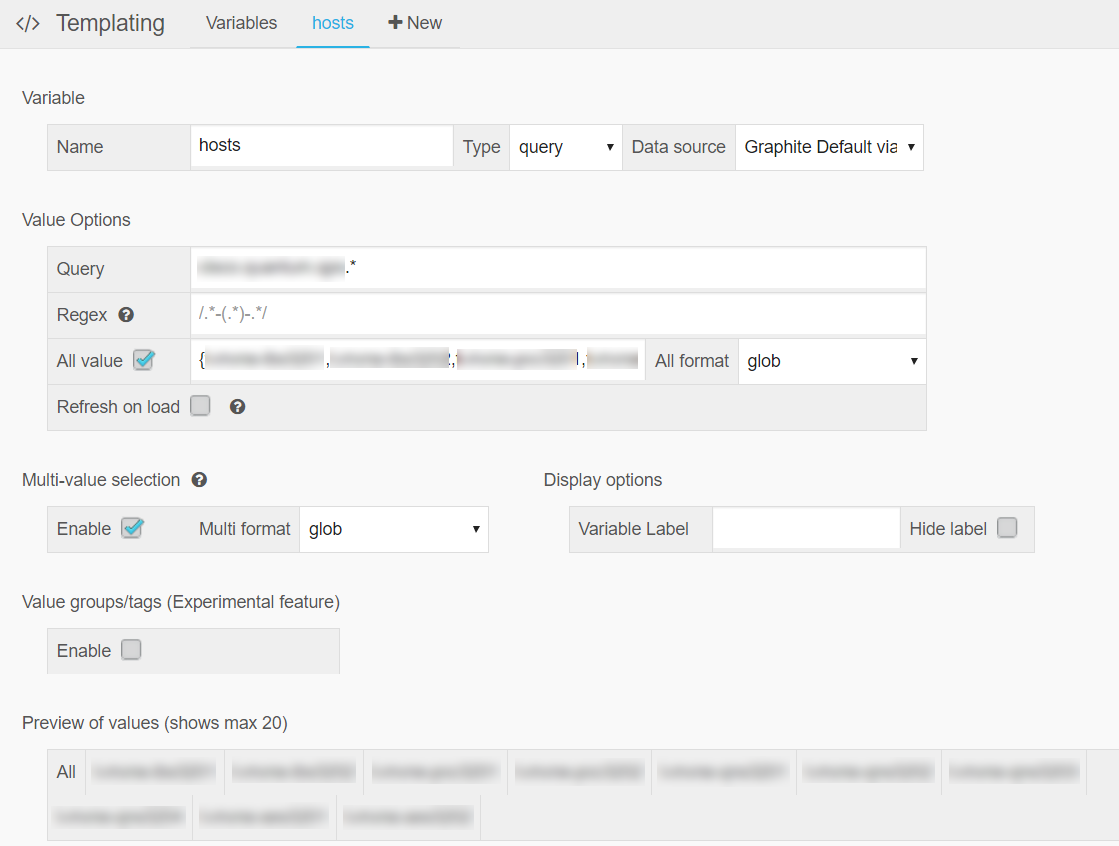
Templateを設定します。下図では hosts という名前で設定しています。

Graphiteをデータソースにしている場合は、Type を Query にして適切な Query を書けば host名一覧が取れるので、すげー便利です。InfluxDBをデータソースにしている場合は * が使えないので Type を Custom にして一個づつ定義します。
2. グラフをTemplating対応に設定する
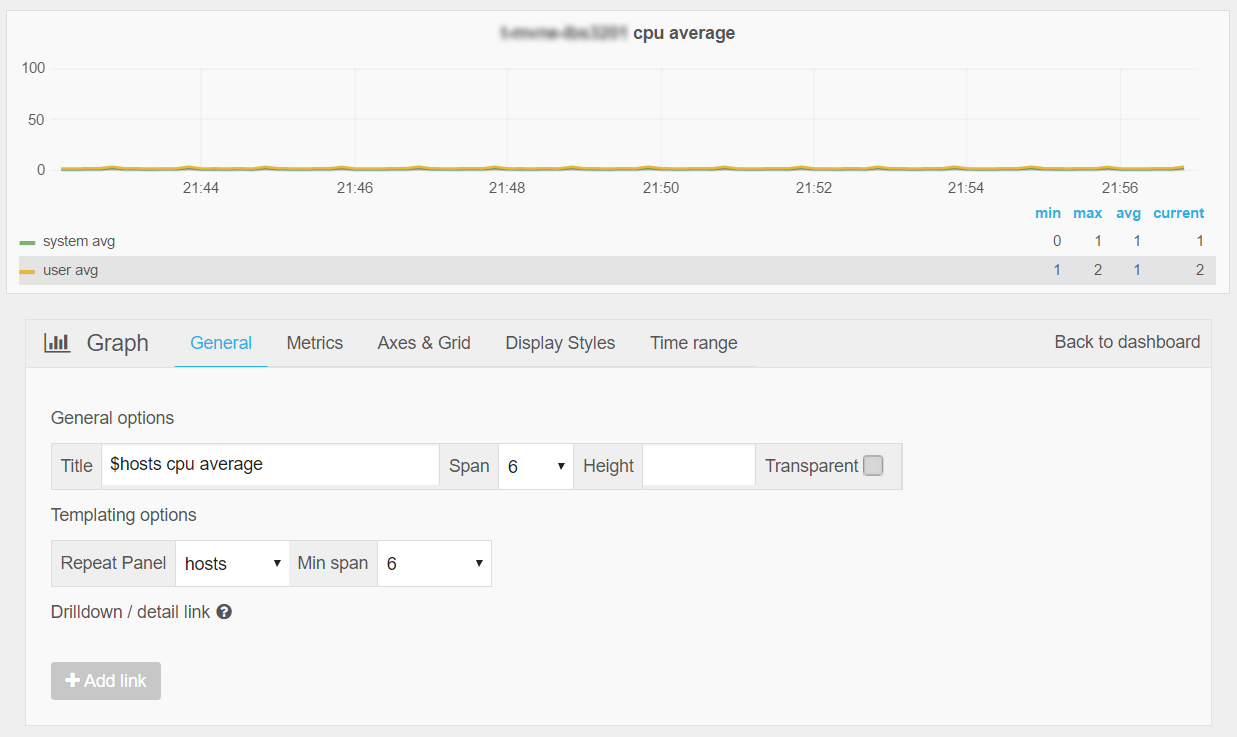
普通にグラフを Edit していきます。まずは General タブ。

Repeat Panel 欄に、「1.templateを設定」で定義した hosts を選択することで、全 host のグラフが出来上がります。
Min Span を6にしておくとグラフサイズが画面幅の半分になります。(意味的にMinじゃなくてMaxっぽい。。)
Title に $hosts と書いてある部分が Templating で変更される部分です。上図ではcpu使用率を複数ホスト分作っています。
描きたいグラフを定義します。$hosts の部分がTemplatingで変更される部分です。
終わり
これだけ!めちゃ簡単です。

