Juliaとは
科学計算の用途を想定して作られた言語。
裏でBLASとか使っているので、速度は速いとうたっている。
R と Julia - RjpWikiにもあるように、結構Rから乗り換える人が増えつつあるようだ。
最初にすること
http://julialang.org/downloads/
で、パッケージを落としきてインストールする。
後述のhomebrewとかで頑張らないほうが楽
miitonさんのこの記事が一番わかり易い
homebrewでjuliaをinstallする(非推奨)
が、あるけど、
- 昔gfortranをgcc時代に入れた人は、入れなおす必要がある
- HEADで何とか入っても、GadflyがまともにIJuliaから動かない
ので、やめたほうが良い
[2015/01/20 追記]
現在では、homebrewで入れるのは問題ありません
詳しくは、Julia環境構築 2014 ver. #julialang - once upon a time,を参照ください。
IJulia+GadflyでPlotting
IJuliaはIPythonを使ってJuliaをブラウザベースでインタラクティブに動かすもの。
GadflyはD3.jsを使っておしゃれなグラフを描画できるようにするもの。
この2つの組み合わせがJuliaのplotで良さそう。matplotlibベースのPyPlotもあるにはある。
echo 'export PATH=$PATH:/Applications/Julia-0.2.0.app/Contents/Resources/julia/bin' >> ~/.bash_profile
source ~/.bash_profile
zshとかの人は適宜読み替えてください。
IPythonに必要なものをpipからインストール。virtualenvとか使いたい人は適宜使ってください。
pip install pyzmq tornado IPython
なお、後述するIJuliaはIPython v 1.0.0以降じゃないといけない。古いIPythonは窓から投げ捨てるべし。
起動。
julia
IJuliaとPyPlot, Gadflyを入れておく(PyPlotいらないかも)
Pkg.add("IJulia")
Pkg.add("PyPlot")
Pkg.add("Gadfly")
IJuliaの起動
ipython notebook —profile julia
新しくnotebookを作って、そこで操作をする。
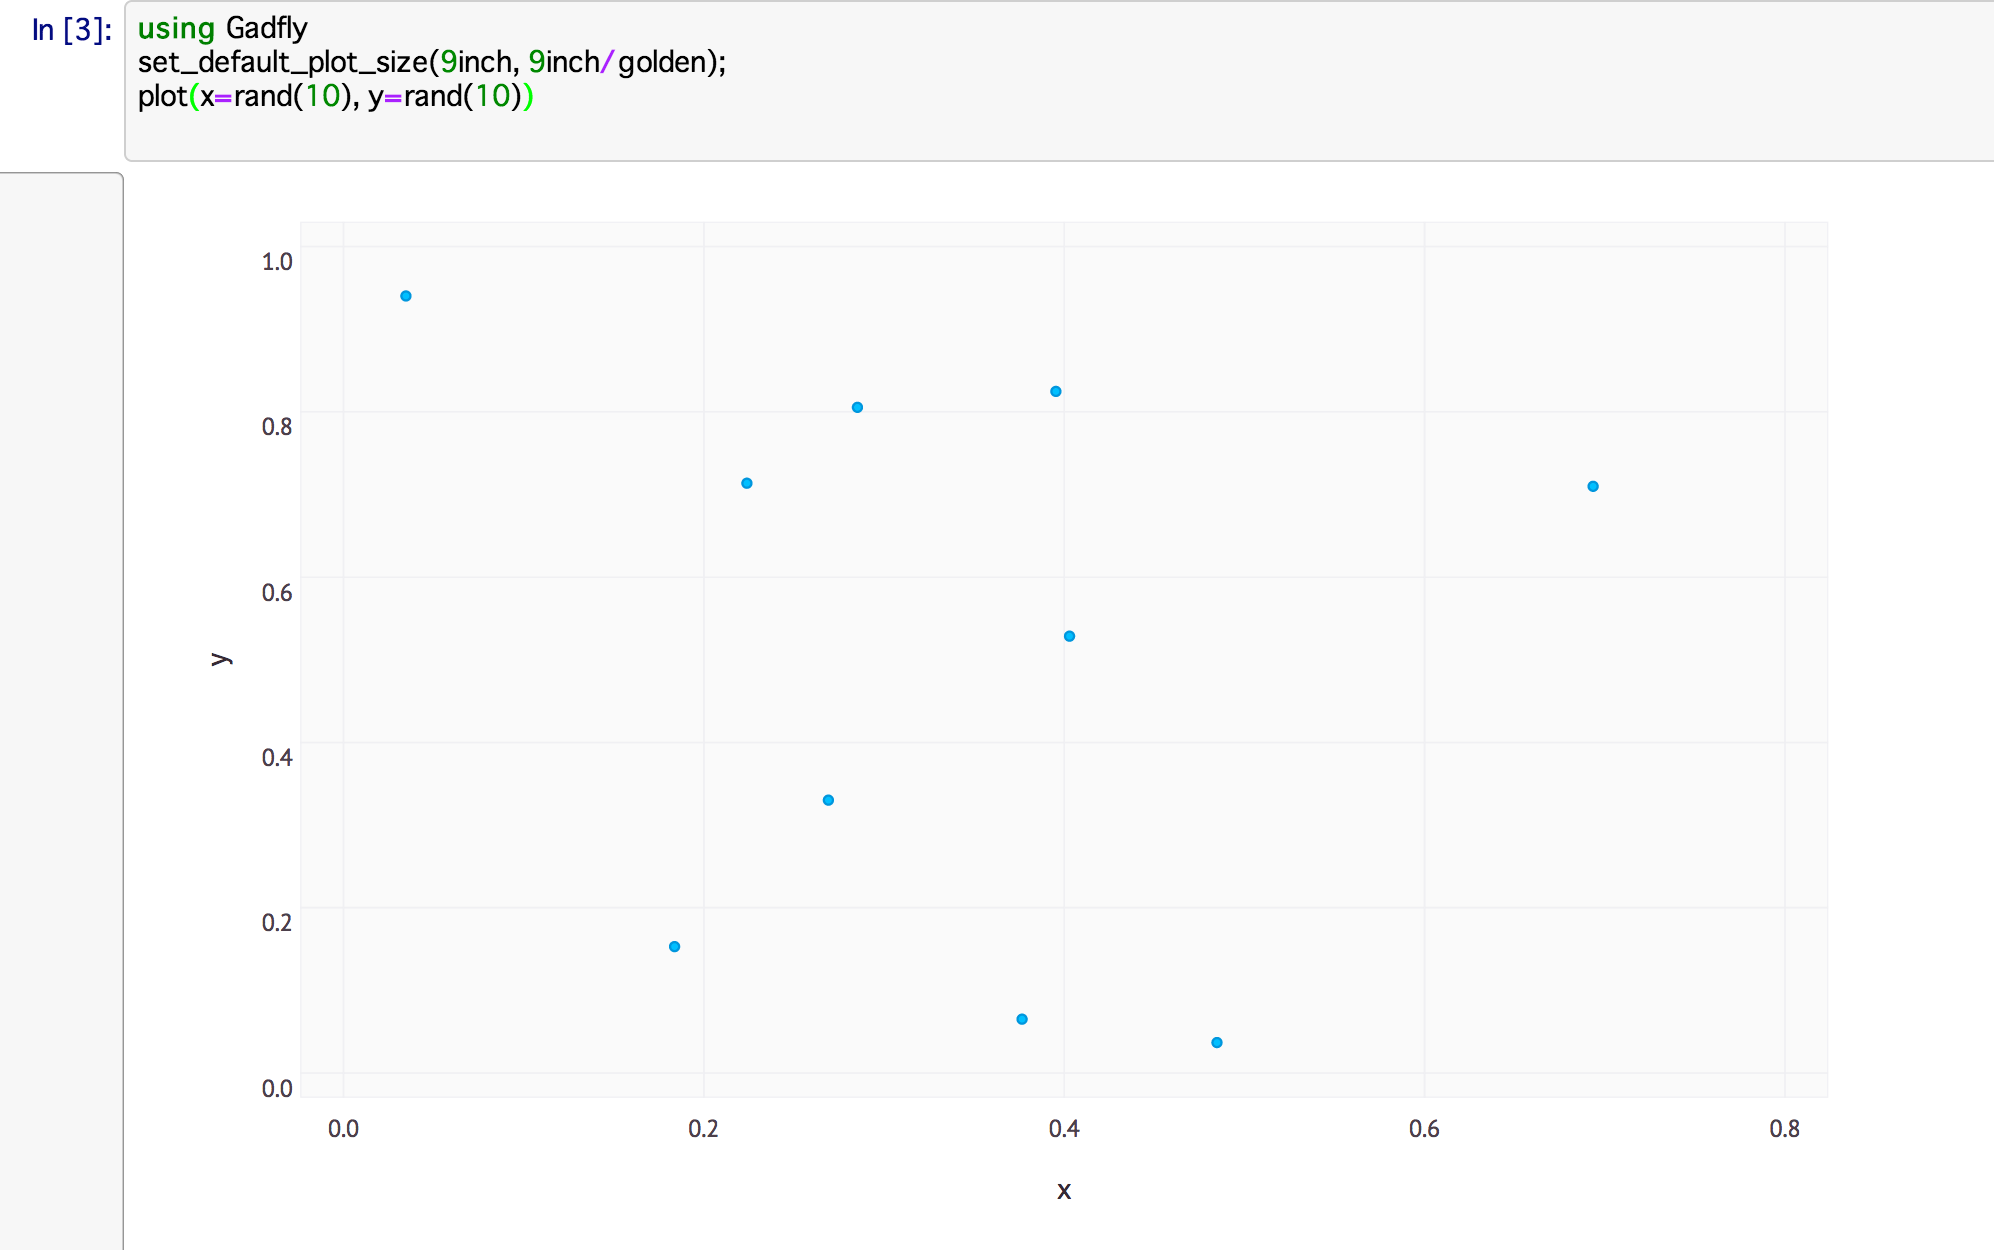
using Gadfly
set_default_plot_size(9inch, 9inch/golden);
plot(x=rand(10), y=rand(10))
今の行のコードをRunするのには、Shift+EnterでOK
すると、こんなplotが出る
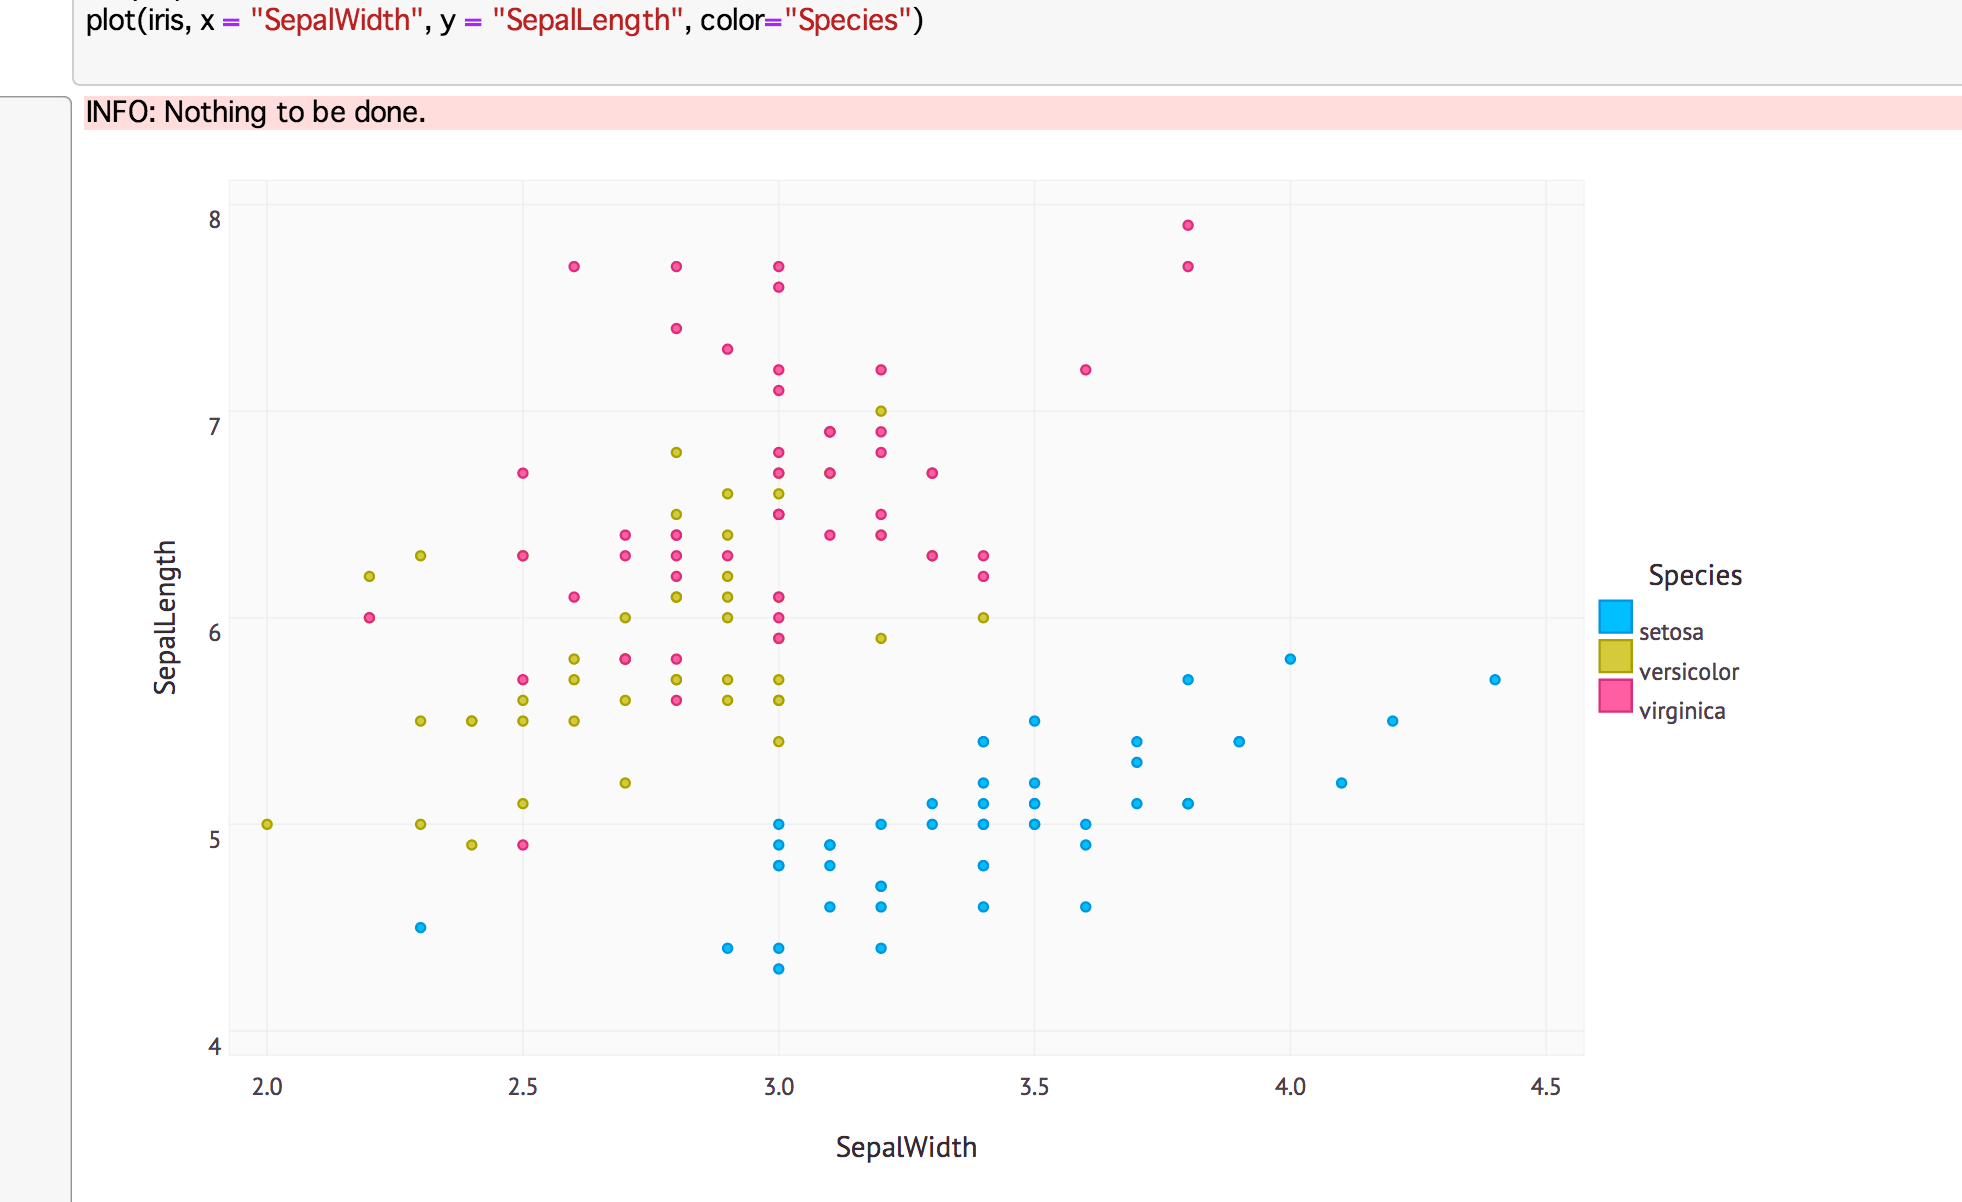
Rでいつもみるirisを
The State of Statistics in Julia
より
Pkg.add("RDatasets")
using RDatasets

iris = data("datasets", "iris")
headや、
head(iris)
tailなんかもできる。
tail(iris)
using Gadfly
set_default_plot_size(9inch, 9inch/golden);

plot(iris, x = "SepalWidth", y = "SepalLength", color="Species")
k-meansを試してみる
Pkg.add("Clustering")
using Clustering
x = rand(100, 10000)
k = 50
result = kmeans(x, k; max_iter=50, display=:iter)
# Show Cluster ID
result.assignments
SVM
v0.3系向けの記事を書きました
http://qiita.com/chezou/items/03e648f04a2f9bbdb74b
# https://github.com/JuliaStats/SVM.jl の READMEからほぼ引用
Pkg.add("SVM")
using SVM
using RDatasets

# Read iris data
iris = data("datasets", "iris")

# SVM format expects observations in columns and features in rows
X = matrix(iris[:, 1:4])’
p, n = size(X)

# SVM format expects positive and negative examples to +1/-1
Y = [species == "setosa" ? 1.0 : -1.0 for species in iris[:, "Species"]]

# Select a subset of the data for training, test on the rest.
train = randbool(n)

# We'll fit a model with all of the default parameters
model = svm(X[:,train], Y[train])

# And now evaluate that model on the testset
accuracy = nnz(predict(model, X[:,~train]) .== Y[~train])/nnz(~train)
LogisticRegressoin
Pkg.add("Regression")
# 2014/02/15現在、Pkg.add(“Regression”)で入るバージョンは、バグが含まれている
Pkg.pin("Regression")
LogisticRegressionのサンプルコードは、Winstonというパッケージで描画する前提なので、下記のexample code叩いたほうが速い(Gadflyで描画する方法を調べる)
julia ~/.julia/Regression/examples/logireg.jl
と、試してみたところで、Winstonで描画できないことに気づいた。。。
気をつけること
- IJulia使っている時に、
using PyPlotとusing Gadflyを混ぜるとplot()が混ざって大変危険 - 名前空間がぶつかることが多々あるので、怪しくなったらKernel restartするのが良い
- パッケージでは、Documentと食い違いがあったりバグがあったりする。
-
Pkg.add()で入るものが古い(=バグがある)場合があるので、Pkg.pin()で必要に応じて最新版を - パッケージ最新版にしても、exampleコードがバグって動かない時もある
-
感想
- Pkg.add("hoge")でパッケージをほいほい入れられるのは楽
- Rから援用したDataFramesを利用するコードが好まれるなど、Rの文化が色濃くなりそうな感じ
- 速度的には真面目に計測していないのでなんとも言えないけど、遅い印象はあまりない
- globalな名前空間で衝突することがままある(
plot()など)のがちょっとつらい

