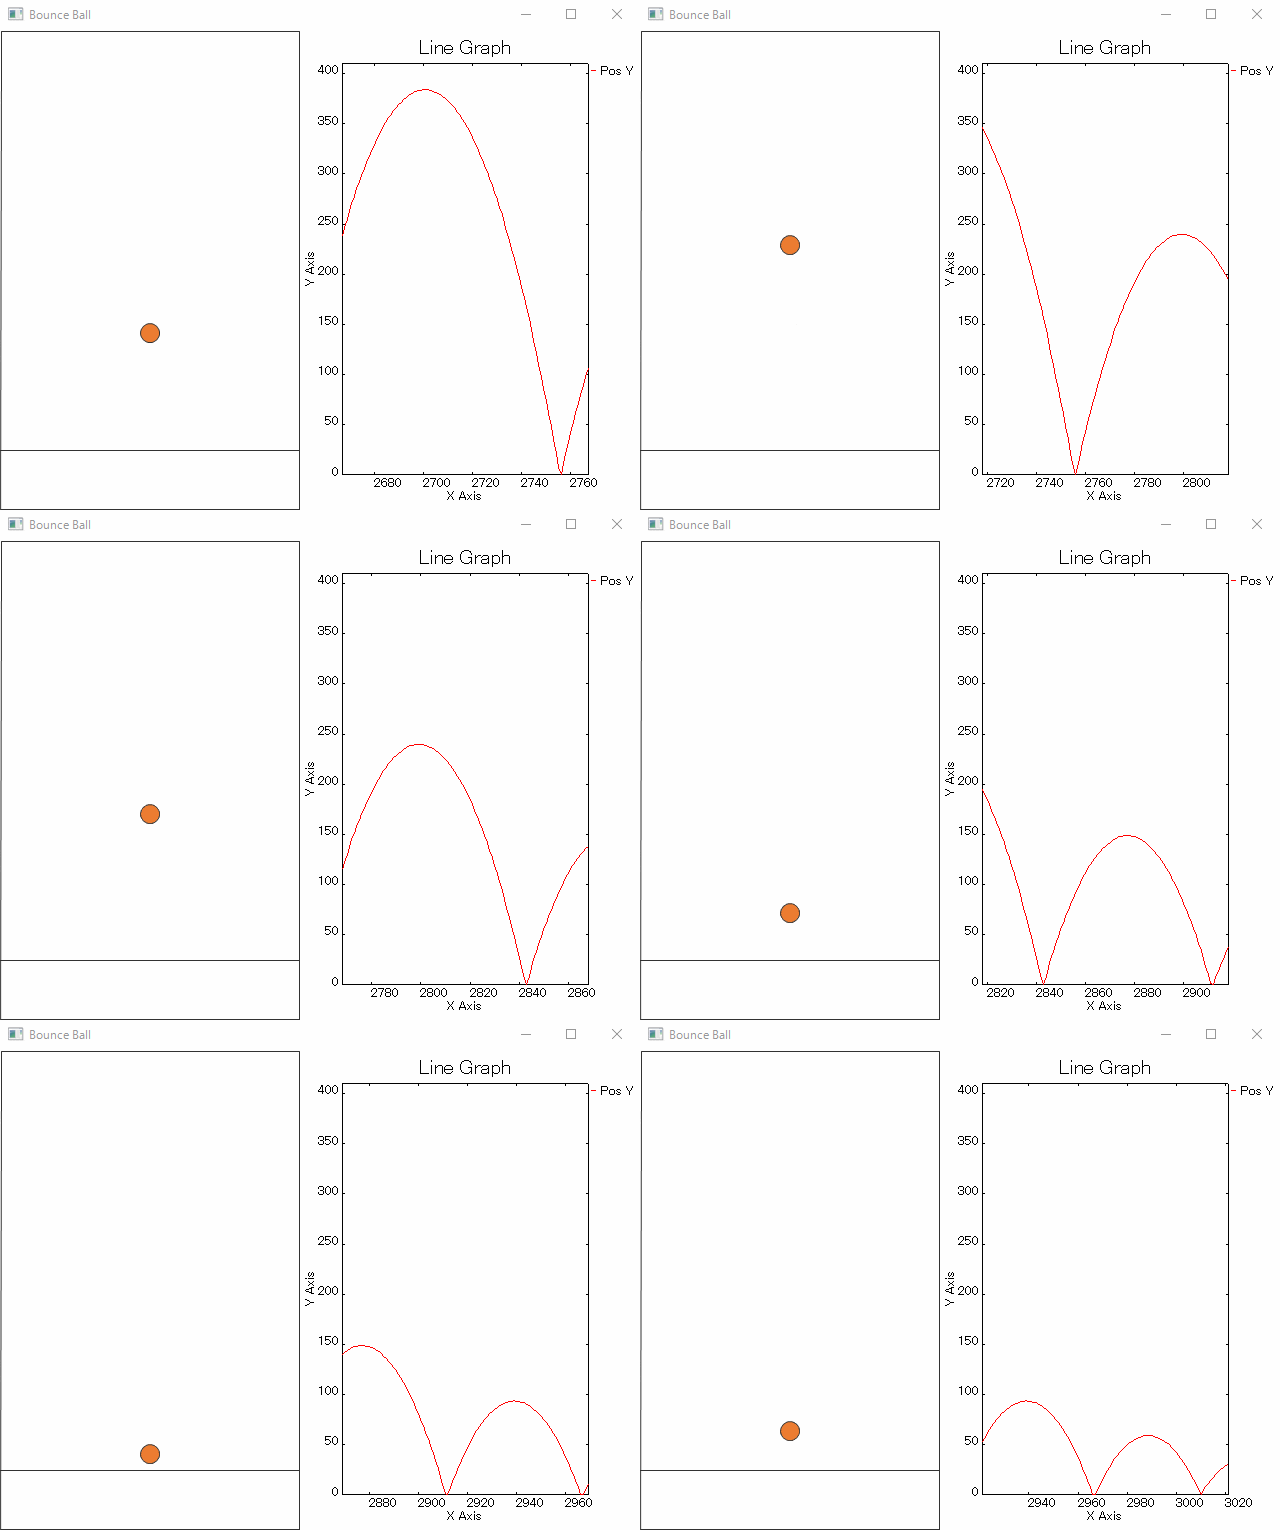
ChainerでやってみるDeep Q Learning - 立ち上げ編 - Qiitaでわからなかった
画面の下方にグラフを追加したいと思っています
環境
- Python 2.7 32bit
- wxPython3.0-win32-py27 / www.wxpython.org/download.php
準備
Windowsインストーラ版のwx.lib.plotはplot.pyにバグがあってプロットができないので、
C:\Python27\Lib\site-packages\wx-3.0-msw\wx\lib\plot.pyを書き換える。
書き換え元はGithubの最新版 ⇒ こちら wxPython/plot.py at master · wxWidgets/wxPython
参考:
Crash on pyplot demo - Google Groups
インポート
特に工夫なし
import wx
import wx.lib
import wx.lib.plot as plot
ウィンドウ・フレームの準備
いきなり結論になりますが、
Frame->Panel
->BoxSizer ->Plot(アニメーション)
->PlotCanvas(グラフ)
という、ぶら下がり構造でパネルやらを定義して、アニメとグラフをプロットするだけ。
class MyWindow(wx.Frame):
    def __init__(self, parent=None, id=-1, title=None):
        wx.Frame.__init__(self, parent, id, title)

        self.MainPanel = wx.Panel(self, size=(640, 480))

        self.panel = wx.Panel(self.MainPanel, size=(300, 480))
        self.panel.SetBackgroundColour('WHITE')

        self.plotter = plot.PlotCanvas(self.MainPanel, size=(340, 480))
        self.plotter.SetEnableZoom(False)
        self.plotter.SetEnableLegend(True)
        self.plotter.SetFontSizeLegend(20)

        self.i = 0
        self.data = []
        line = plot.PolyLine(self.data, legend='Dummy', colour='pink', width=2)
        self.gc = plot.PlotGraphics([line], 'Line Graph', 'X Axis', 'Y Axis')
        self.plotter.Draw(self.gc, xAxis=(0,15), yAxis=(0,15))
        self.plotter.SetFontSizeLegend(point=10.5)

        mainSizer = wx.BoxSizer(wx.HORIZONTAL)
        mainSizer.Add(self.panel)
        mainSizer.Add(self.plotter)

        self.SetSizer(mainSizer)

        self.Fit()
アニメーションしながらのグラフ更新
OnTimerでアニメをしていますが、その最後にグラフ更新を追加するだけ
        self.data.append((self.i, groundH - self.ball.pos_y))
        if len(self.data) >= 100:
            self.data = self.data[-101:]

        line = plot.PolyLine(self.data, legend='Pos Y', colour='red', width = 1)
        self.gc = plot.PlotGraphics([line], 'Line Graph', 'X Axis', 'Y Axis')
        self.plotter.Draw(self.gc, xAxis=(max(0,self.i-100), self.i), yAxis=(0, groundH))
        self.i += 1
コード全部
# -*- coding: utf-8 -*-
import wx
import wx.lib
import wx.lib.plot as plot

import math

dT = 20
g  = 640.0
groundH = 410

class Ball(object):
    def __init__(self, panel, x, y, color):
        self.pos_x = float(x)
        self.pos_y = float(y)

        self.vx = 0.0
        self.vy = 0.0

        self.rad = 10.0

        self.pos_x_max, self.pos_y_max = panel.GetSize()
        self.B_color = color
        self.P_color = wx.Colour(50,50,50)

    def Move(self, ax = 0.0, ay = 0.0):
        self.vx += ax * dT / 1000.0
        self.vy += ay * dT / 1000.0

        self.pos_x += self.vx * dT / 1000.0
        self.pos_y += self.vy * dT / 1000.0

        self.pos_x = max(0, min(self.pos_x, self.pos_x_max))
        self.pos_y = max(0, min(self.pos_y, groundH))

    def Draw(self, dc):
        dc.SetPen(wx.Pen(self.P_color))
        dc.SetBrush(wx.Brush(self.B_color))
        dc.DrawCircle(self.pos_x, self.pos_y, self.rad)

    def IntersectBall(self, p0, v0):
        o = [-self.pos_x + p0[0], -self.pos_y + p0[1]]

        a = v0[0] ** 2 + v0[1] **2
        b = 2 * (o[0]*v0[0]+o[1]*v0[1])
        c = o[0] ** 2 + o[1] **2 - self.rad ** 2

        discriminant = float(b * b - 4 * a * c)

        if discriminant < 0:
            return [False, 1.0]

        discriminant = discriminant ** 0.5

        t1 = (- b - discriminant)/(2*a)
        t2 = (- b + discriminant)/(2*a)

        if t1 >= 0 and t1 <= 1.0:
            return [True, t1]

        if t2 >= 0 and t2 <= 1.0:
            return [True, t2]

        return [False, 1.0]

class Walls(object):
    def __init__(self, x0, y0, x1, y1):
        self.xList = [x0, x1]
        self.yList = [y0, y1]
        self.P_color = wx.Colour(50,50,50)

    def addPoint(self, x, y):
        self.xList.append(x)
        self.yList.append(y)

    def Draw(self,dc):
        dc.SetPen(wx.Pen(self.P_color))
        for i in range(0, len(self.xList)-1):
            dc.DrawLine(self.xList[i], self.yList[i], self.xList[i+1],self.yList[i+1])

class MyWindow(wx.Frame):
    def __init__(self, parent=None, id=-1, title=None):
        wx.Frame.__init__(self, parent, id, title)

        self.MainPanel = wx.Panel(self, size=(640, 480))

        self.panel = wx.Panel(self.MainPanel, size=(300, 480))
        self.panel.SetBackgroundColour('WHITE')

        self.plotter = plot.PlotCanvas(self.MainPanel, size=(340, 480))
        self.plotter.SetEnableZoom(False)
        self.plotter.SetEnableLegend(True)
        self.plotter.SetFontSizeLegend(20)

        self.i = 0
        self.data = []
        line = plot.PolyLine(self.data, legend='Dummy', colour='pink', width=2)
        self.gc = plot.PlotGraphics([line], 'Line Graph', 'X Axis', 'Y Axis')
        self.plotter.Draw(self.gc, xAxis=(0,15), yAxis=(0,15))
        self.plotter.SetFontSizeLegend(point=10.5)

        mainSizer = wx.BoxSizer(wx.HORIZONTAL)
        mainSizer.Add(self.panel)
        mainSizer.Add(self.plotter)

        self.SetSizer(mainSizer)

        self.Fit()

        self.ball = Ball(self.panel, 150, 100, wx.Colour(237,125,49))

        # OutrBox
        self.Box = Walls(299, 479, 0, 479)
        self.Box.addPoint(1,1)
        self.Box.addPoint(299,1)
        self.Box.addPoint(299,480)

        # Ground
        self.Ground = Walls(0, 420, 300, 420)
        self.HitGround = False

        self.Bind(wx.EVT_CLOSE, self.CloseWindow)

        self.cdc = wx.ClientDC(self.panel)
        w, h = self.panel.GetSize()
        self.bmp = wx.EmptyBitmap(w,h)

        self.timer = wx.Timer(self)
        self.Bind(wx.EVT_TIMER, self.OnTimer)
        self.timer.Start(dT)

    def CloseWindow(self, event):
        self.timer.Stop()
        wx.Exit()

    def OnTimer(self, event):
        self.bdc = wx.BufferedDC(self.cdc, self.bmp)
        self.gcdc = wx.GCDC(self.bdc)

        self.gcdc.Clear()

        if self.HitGround and self.ball.vy > 0.1:
            self.ball.vy *= -0.8

        if (0.5*self.ball.vy **2 + g * (groundH - self.ball.pos_y)) < g *(groundH - 408) \
            and (groundH - self.ball.pos_y) < 2.0:
            ay = - ((groundH * g * 2.0 * 0.8) ** 0.5 / dT * 1000)
        else:
            ay = g

        self.ball.Move(ay = ay)
        self.HitGround,_ = self.ball.IntersectBall([0,420], [300, 0])

        self.gcdc.SetPen(wx.Pen('white'))
        self.gcdc.SetBrush(wx.Brush('white'))
        self.gcdc.DrawRectangle(0,0,300,480)

        self.ball.Draw(self.gcdc)
        self.Box.Draw(self.gcdc)
        self.Ground.Draw(self.gcdc)

        self.data.append((self.i, groundH - self.ball.pos_y))
        if len(self.data) >= 100:
            self.data = self.data[-101:]

        line = plot.PolyLine(self.data, legend='Pos Y', colour='red', width = 1)
        self.gc = plot.PlotGraphics([line], 'Line Graph', 'X Axis', 'Y Axis')
        self.plotter.Draw(self.gc, xAxis=(max(0,self.i-100), self.i), yAxis=(0, groundH))
        self.i += 1


if __name__ == '__main__':
    app = wx.PySimpleApp()
    w = MyWindow(title='Bounce Ball')
    w.Center()
    w.Show()
    app.MainLoop()
