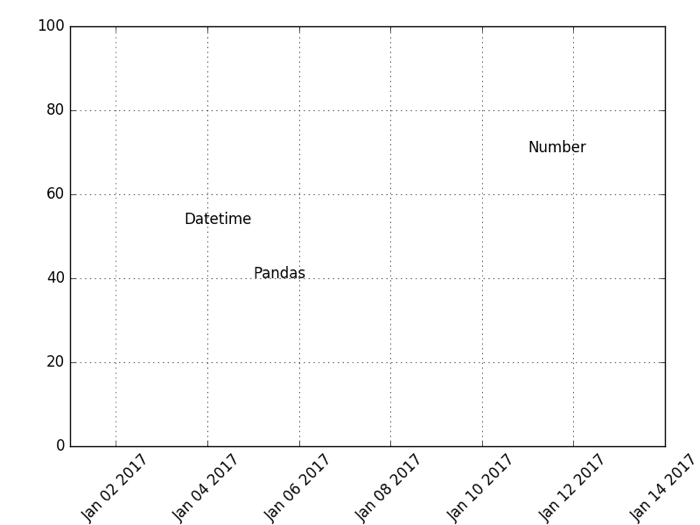
時間軸グラフへのコメント挿入(axis.text(), axis.annotate())は、対象軸では、時間で指定1。
import sys
import matplotlib as mpl
mpl.use('Agg')
import matplotlib.pyplot as plt
import matplotlib.dates as dates
from datetime import datetime as dt
import pandas as pd

fig, ax = plt.subplots()
ax.xaxis_date()
ax.set_xlim([dt(2017,1,1),dt(2017,1,14)])
ax.set_ylim([0,100])
ax.grid(True)
ax.text(dt(2017,1,3,12,0), 53, "Datetime")
ax.text(pd.Timestamp("2017-1-5"), 40, "Pandas")
ax.text(736340, 70, "Number") #1

plt.xticks(rotation=45)
fig.subplots_adjust( bottom=0.15, top=0.95,left=0.1, right=0.95)
plt.savefig("comment.png")
$ python comment.py
datetime でも pd.Timestamp でも良さげ。
時間軸に用いる数値について
Matplotlib provides sophisticated date plotting capabilities, standing on the shoulders of python datetime, the add-on modules pytz and dateutil. datetime objects are converted to floating point numbers which represent time in days since 0001-01-01 UTC, plus 1. For example, 0001-01-01, 06:00 is 1.25, not 0.25. The helper functions date2num(), num2date() and drange() are used to facilitate easy conversion to and from datetime and numeric ranges.
だ、そうで。
2016-12-31 00:00:00(UTC) を閏年ふくめ、ざっと計算させてみると、
$ perl -le '$a += ($_ % 4 == 0 and $_ % 100 == 0 and $_ % 400 != 0 )? 365 : $_ % 4 == 0 ? 366 : 365 for 1 .. 2016  ; print $a'
736329
$ python -c 'import matplotlib.dates as md ; print(md.num2date(736329))'
2016-12-31 00:00:00+00:00
となる。で、上の#1は、2017-01-11 00:00:00+00 を指定したのと同じ事。
時分秒に関しては、小数点以下に2。
