CloudWatch Metrics
In our project, we use the standard CloudWatch Metrics to monitor performance and issues in production. For example, if CPU utilization on a server exceeds 80% for more than 5 minutes, an alarm triggers and sends us an email.
We've also built a few simple CloudWatch Dashboards for monitoring different parts of our system. It's a great way to get a quick overview.
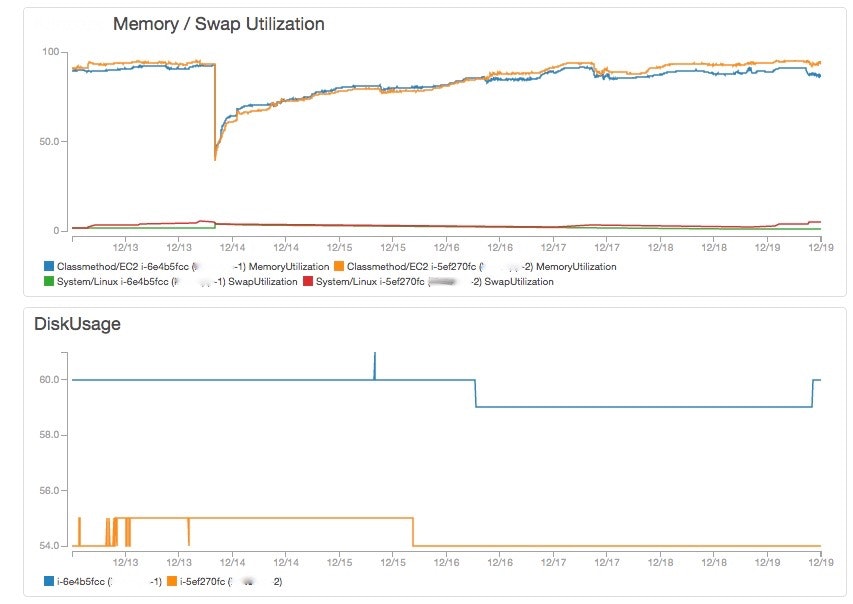
Missing metrics: memory, swap, disk utilization
In addition to the standard metrics, we've added system level metrics like memory, swap and disk utilization. AWS provides a Perl script for that which can be run as a cron job:
http://docs.aws.amazon.com/ja_jp/AWSEC2/latest/UserGuide/mon-scripts.html
Custom metrics
We are using batch workers (ActiveJob via delayed_job) to handle long running requests, such as importing bulk data from files, or rendering large PDF files. These functions are used all the time by customers, so we need a health check for our worker processes.
To do this, we implemented our own simple custom AWS metric: "delayed-job::WorkerProcesses".
# This works on OSX and AWS Linux servers
pids = `pgrep -f delayed_job`.split
Rails.logger.info("Worker health check. #{pids.size} worker processes found (#{pids.join(',')})")

log_cloudwatch_metrics(
  namespace: 'delayed-job',
  aws_metrics: [AWSMetrics::Metric.new(name: 'WorkerProcesses', value: pids.size)]
)
Now we can see the metric in Cloudwatch like any other metric, and add alarms etc.
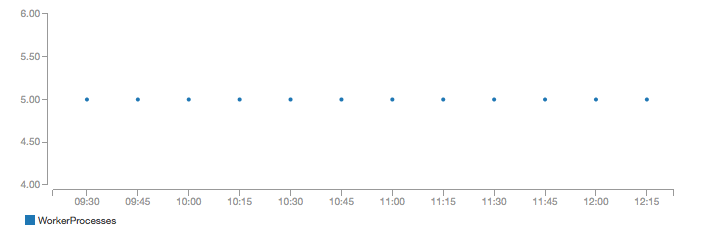
The check is run from a periodic batch job using delayed_job_recurring. That way, we know that the worker processes are running, and jobs are being processed successfully.
CloudWatch Metrics wrapper
Sending AWS Metrics is quite simple using the AWS SDK for Ruby, but the request format is a bit complex, with many fields to fill out. To make it simpler, we implemented a small wrapper with sensible defaults:
module AWSMetrics

  def log_cloudwatch_metrics(namespace:, aws_metrics:)
    cloudwatch_client.put_metric_data(
      namespace: "ProjectX/#{namespace}",
      metric_data: aws_metrics.map(&:to_h)
    )
  end

  def cloudwatch_client
    Aws::CloudWatch::Client.new(region: ENV['AWS_REGION'].presence || 'ap-northeast-1')
  end

  class Metric
    VALID_UNITS = [
      'Seconds', 'Microseconds', 'Milliseconds',
      'Bytes', 'Kilobytes', 'Megabytes', 'Gigabytes', 'Terabytes',
      'Bits', 'Kilobits', 'Megabits', 'Gigabits', 'Terabits',
      'Percent', 'Count',
      'Bytes/Second', 'Kilobytes/Second', 'Megabytes/Second', 'Gigabytes/Second', 'Terabytes/Second',
      'Bits/Second', 'Kilobits/Second', 'Megabits/Second', 'Gigabits/Second', 'Terabits/Second',
      'Count/Second',
      'None'
    ]

    attr_reader :name, :value, :aws_unit_string, :hostname, :timestamp

    def initialize(name:, value:, aws_unit_string: 'Count', hostname: Socket.gethostname, timestamp: Time.now)
      fail 'Invalid Unit' unless VALID_UNITS.include?(aws_unit_string)
      @name = name
      @value = value
      @aws_unit_string = aws_unit_string
      @hostname = hostname
      @timestamp = timestamp
    end

    def to_h
      {
        metric_name: @name,
        dimensions: [
          {
            name: 'hostname',
            value: @hostname
          }
        ],
        timestamp: @timestamp,
        value: @value,
        unit: @aws_unit_string
      }
    end
  end

end
Thanks for reading!